Playing with Maps in Tableau: Making Mapping Really Interactive
A few weeks ago, during one of the Tableau sessions we like to do between BI consultants at InterWorks, Dave showed a Tableau trick he used to make map visualisations in Tableau more dynamic and intuitive for the end user. The trick was a smart use of a blending on the level of detail to swap between […]
OK Freewheel 2016 as Told by Social Media

Call us gluttons for punishment, but there’s just something about cycling with your friends and coworkers across the state in the oppressive heat that really creates some lasting memories. You may have heard, but only a week-and-a-half ago, Team InterWorks completed their second consecutive OK Freewheel bike tour. The tour always occurs in the dead […]
PYD11 – Nolen Akerman – Senior Data Scientist

Nolen Akerman, Senior Data Scientist, joins Dan Murray and talks about rethinking long-form visualizations with immersion rooms, replaying the weather with Tableau, how analytics and IT can coexist, and the benefits of being involved in a user group.
They Ate the Whole Thing(s): Visualizing Nathan’s Hotdog Eating Championship in Tableau
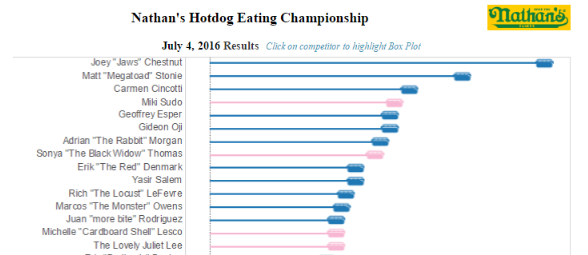
Yesterday, Nathan’s had their annual hotdog eating championship in Coney Island, New York. The men’s winner was the dominant Joey Chestnut who consumed 70 hotdogs in 10 minutes. Ladies winner Miki Sudo ate 39 hotdogs. Ouch! I think that I’d need more than one antacid after that kind of self-abuse. Thanks to FiveThirtyEight for their inspirational […]
What the Dell and EMC Merger Means for InterWorks and You

You may have heard the buzz lately about a gigantic merger in the IT world. A few months back, Dell announced that they would be acquiring EMC for $67 billion. That’s a lot of dough, but the benefits seem like they’ll be well worth the price tag. This new merger essentially means that together, as […]
Material Design and Tableau
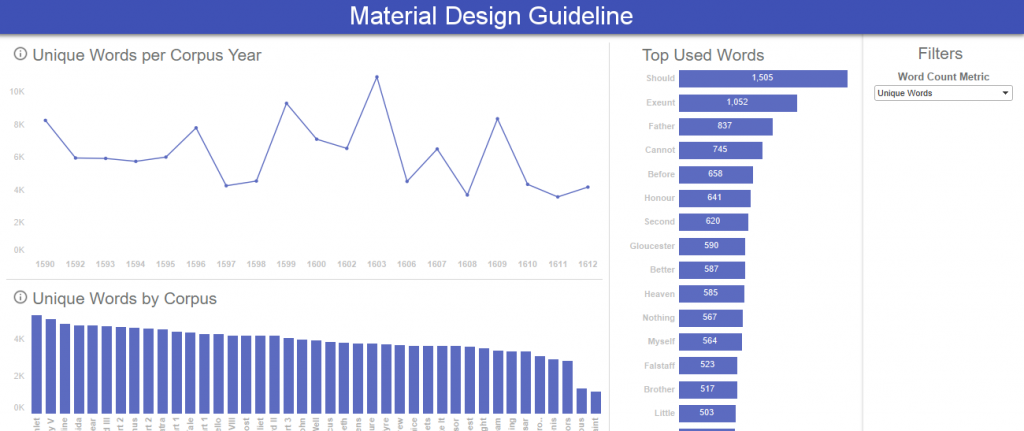
Have you ever interacted with Google/Android’s gorgeous visual identity and wondered, “What is this, and how can I make Tableau look like that?” If your answer was a resounding yes, let me walk you through how we go about answering both the “What?” and the “How?” of Material Design, Google’s new visual language. What Is […]
The Freewheel Foodie

I peer over my extended gut, leaning slightly forward with my head almost resting on the wall examining the digital output of by Bluetooth scale. Five pounds? How could I have gained five pounds in the last week? I was one day removed from a second annual effort pedaling my bicycle across the state of […]
3 Reasons Why You Should Want a Data Warehouse
I hear a lot of reasons people avoid a data warehouse: It takes too long to build, data warehouse projects are expensive and often end in failure, I’m good with a dedicated table to support each of my reports. In future posts, we’ll look more closely at some of these justifications to avoid a data warehouse, […]
Analyzing Strava Data: Part 1 – Exporting and Parsing Segments with Alteryx
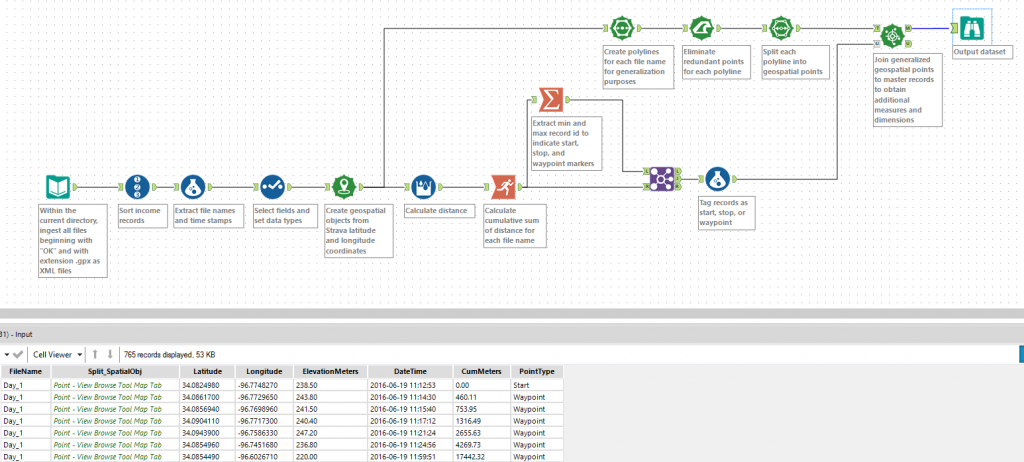
Are you an avid cyclist who regularly uses Strava to track segments and claim K/QOM? Are you a data fiend that yearns to analyze and manipulate fitness tracker data in Alteryx for visualization in Tableau? Well, now you can! In this two-part series, I’ll detail the process I used in analyzing my recent OK Freewheel journey. Step […]
Extract Geological Data Directly into Tableau with Our USGS Web Data Connector
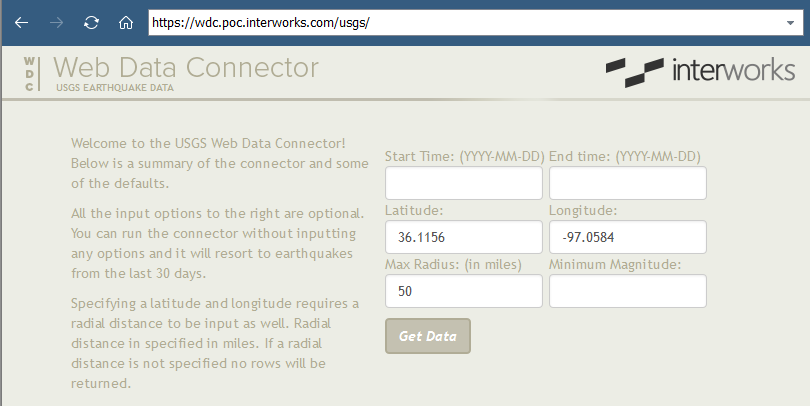
As a data-driven society and Tableau junkies, connecting to your favorite data sources easier is definitely a welcome sight. Tableau does this very well with a slew of standard data connectors. But, what if the data you want to connect to is from a web page? Well, you have options! You might be aware of […]
