Tableau Deep Dive: LOD – The Exclude Calculation
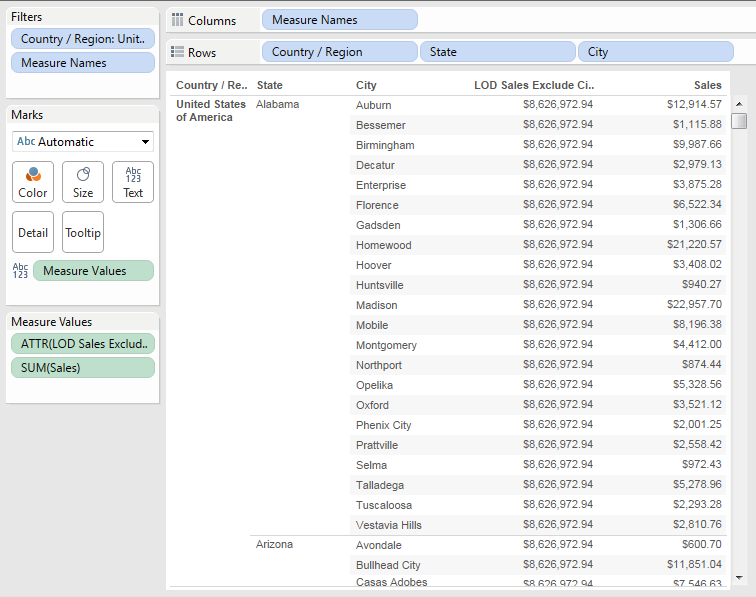
This is the third article in our Tableau Deep Dive on level of detail. Part 1 reviewed the idea of detail. Part 2 introduced level of detail calculations and examined the Include LOD calculation. Let’s now jump into Exclude. A Use Case For our examples in this article, we’ll use the Superstore Sales Training sample data source […]
Date Comparisons in Tableau Made Easy
One of the common problems that clients are seeking to solve is a way to easily compare values from two different periods against each other. They want the ability to compare the same period between two years, a period against an immediately preceding period and current year to date compared to the previous year to […]
Tableau Deep Dive: LOD – The Include Calculation
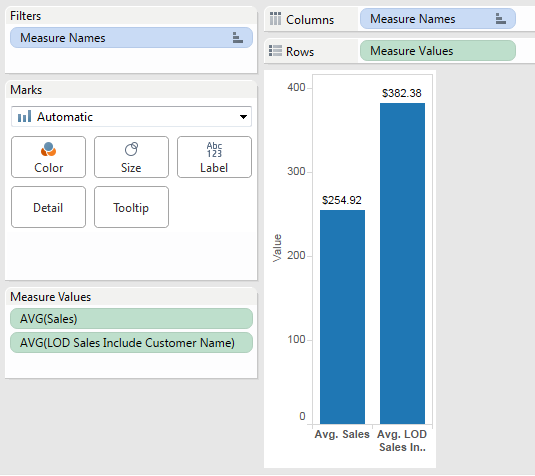
In the previous article of this Deep Dive on LODs, we talked about Detail in general for Tableau Desktop. In Part 2, we’ll explore the Include level of detail calculation. Start With the Data Before I go into Tableau Desktop, I always think it’s foundationally important to discuss what we are trying to do in […]
Storm Chasing in Tableau: How to Create a Weather Map
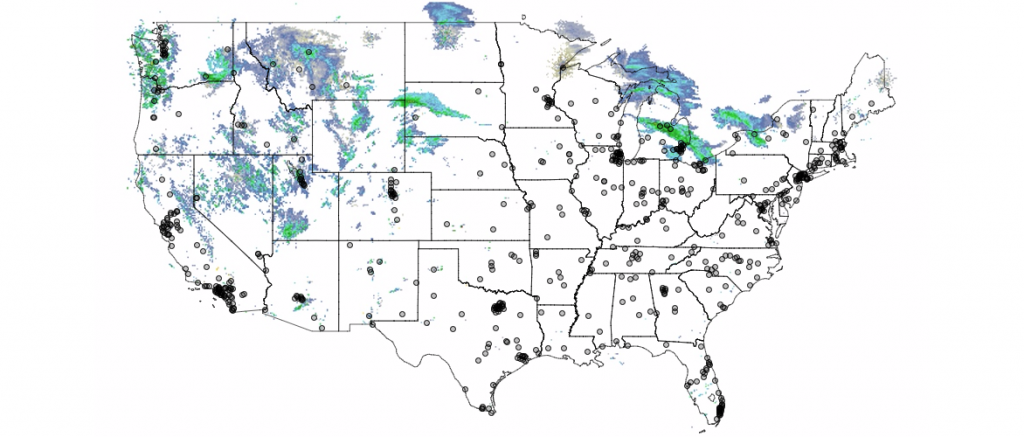
I’ve been a storm chaser since I was eight years old. My grandfather volunteered for the Perkins Civil Defense, and part of his duty was to sit on a hilltop anytime severe weather came into the area. He let me tag along, and I’ve been hooked ever since. After many years chasing tornadoes on the […]
Tableau Deep Dive: LOD – Introduction to Detail
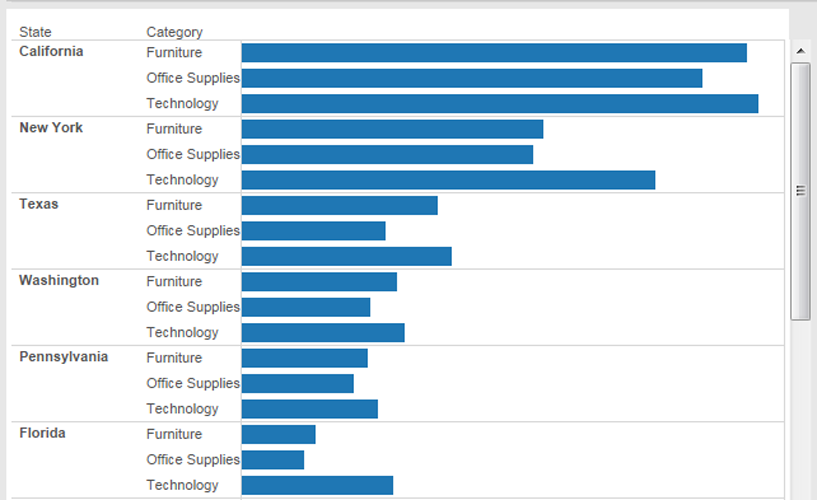
Level of detail (LOD) is a feature that was introduced in Tableau Desktop v9. While it offers a great amount of flexibility and control over how you use the data in your visualization, it can be a bit tricky to fully understand. We teach level of detail in the Advanced course of Tableau training. With […]
We’ve Improved Data Source Audit in Workbook Tools for Tableau!
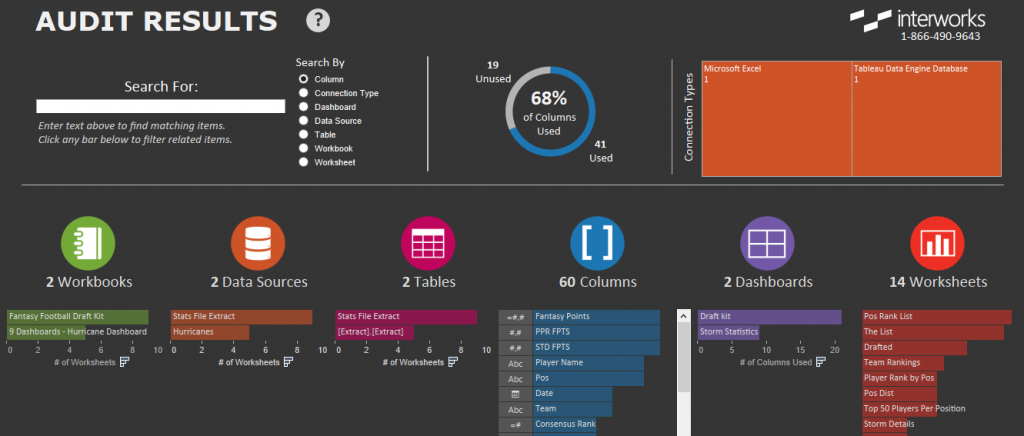
Tableau purchased Power Tools in 2019. Contact Us for more information. A little over a month ago, we released version 1.14 of our Workbook Tools for Tableau. This release was all about our Data Source Audit tool, and we made a couple of really cool enhancements that I want to share with you today. More Intuitive […]
Don’t Get Ticketed in NYC: A Parking Violations Data Viz
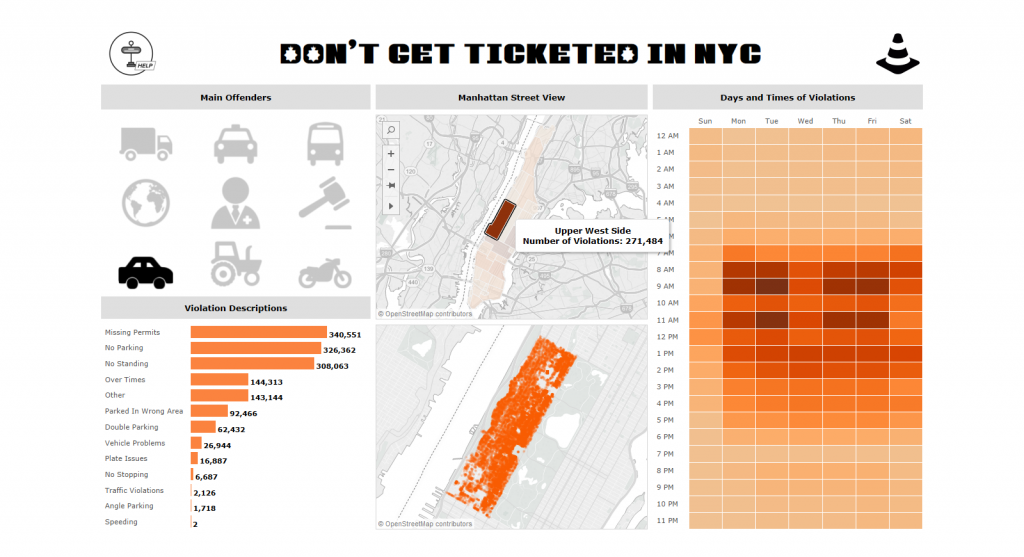
According to ParkWhiz, the rates for hourly parking in New York City can range from $5 all the way up to $250. Adding to that the potential for getting ticketed while parked makes NYC one of the hardest places for drivers to find parking. To explore factors that may help prevent you from getting a ticket, […]
Tableau Driver’s Ed: The Drive Team

We’ve covered several aspects in implementing the Tableau Drive methodology into your organization and shepherding in an enterprise-level deployment. It’s now time to outline the necessary roles within the Drive team. So, what is a Drive team? A Drive team includes organizational members that are responsible for “driving” Tableau projects from concept to completion. The Tableau […]
What Bernie Sanders Needs to Win the Democratic Nomination
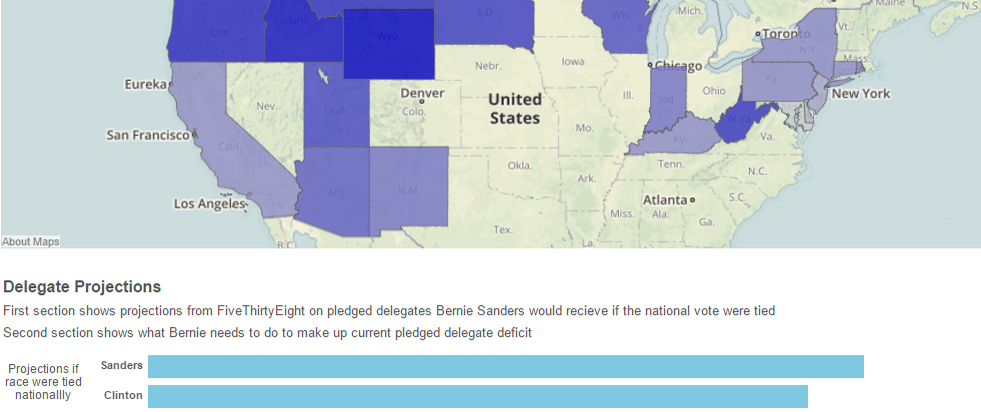
After Hillary Clinton’s strong performance on Tuesday, she now has an advantage of over 300 pledged delegates compared to Bernie Sanders. This total is based solely on votes and doesn’t include her much larger advantage when super delegates are considered. So, where does this leave us? Just about all the remaining states have demographics that favor Bernie, […]
Could a Gasoline Tax Solve Oklahoma’s Education Funding Woes?
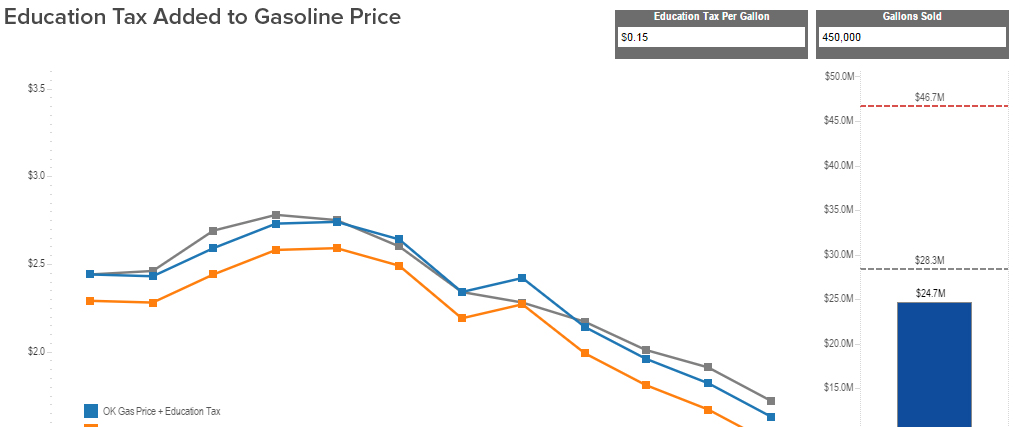
If you’ve watched the news lately, you’ve seen that Oklahoma (along with many other states) is in a budget crisis. In Oklahoma, you hear about many programs that are most likely going to have cuts made to funding. Education is one cut being discussed, but that is something I know myself and many other Oklahomans […]