Quantified Office: Part 4 – Monitoring Coffee with Flic

Have you ever gotten up from your desk, walked over to the office kitchen, reached down to get coffee, only to find an empty coffee pot? If so, you personally know the inspiration behind our next installment in the Quantified Office series. At our office, we have a large metal carafe for coffee (exactly like the metal […]
5 Tips to Get the Most from Tableau Training
It’s 9 a.m., and you’ve just entered the classroom for your Tableau class, whether it’s Fundamentals or Advanced. Or, maybe you’ve just logged into the virtual classroom and are waiting for the rest of the students to show up in the chat window. How much you learn and how well you learn it is a […]
How to Trigger a Hidden View Using Multiple Tableau Worksheets
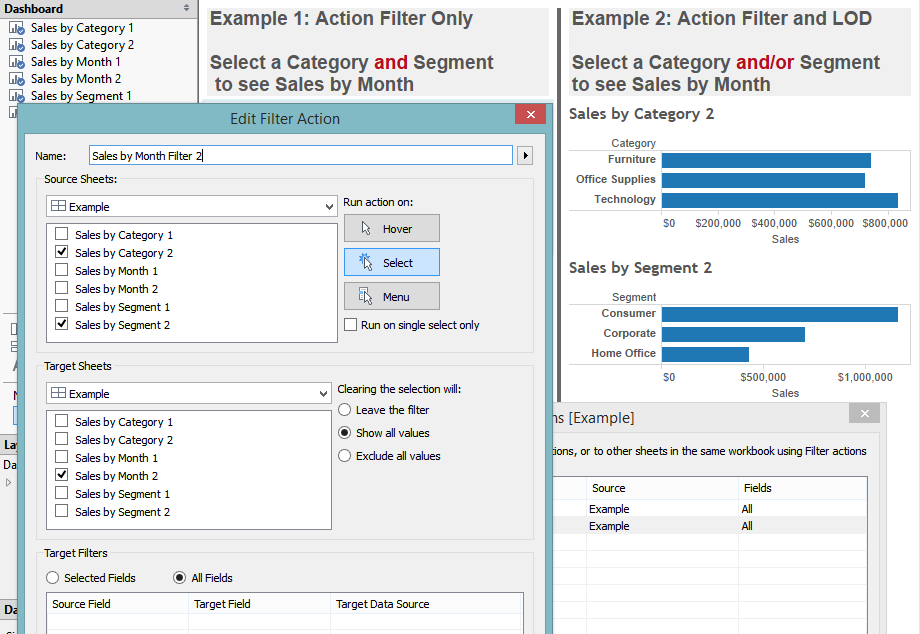
While not a regular occurrence, I have come across situations where a client wants to display a hidden sheet with an action filter but wants to enable different worksheets to activate the hidden sheet. If the sheets are filtering on different fields when you set an action filter to exclude – so the sheet is […]
How to Configure Tableau Server for SAML with OneLogin IdP
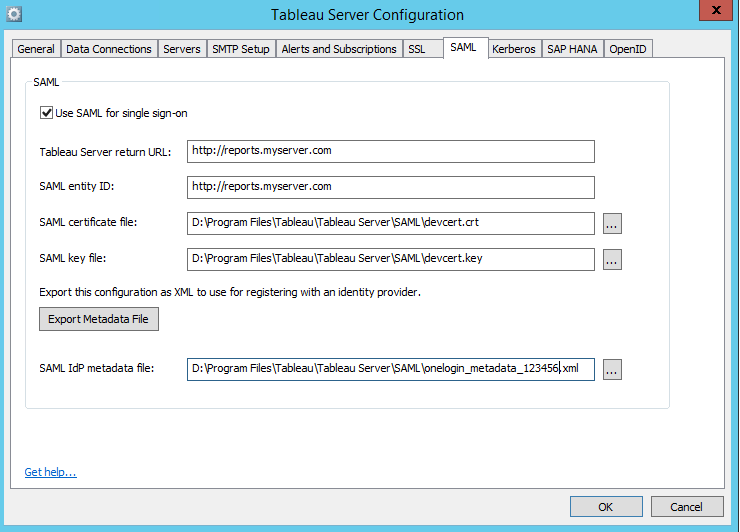
Our client needed to provide external users (their customers) with access to their Tableau Server on Amazon Web Services (AWS). When it came time to discuss authentication, Active Directory (AD), while generally a good choice within an enterprise, was quickly ruled out. They needed an identity/authentication provider that worked outside their network and provided a […]
InterWorks Cracks the 2016 CRN Tech Elite 250
2016 is already shaping up to be a big year for InterWorks! The year is only a quarter over, and we’re already gaining recognition at the local, state, national and global levels. In fact, our most recent accolade was announced just yesterday. We’re proud to share that InterWorks cracked CRN’s Tech Elite 250 list for 2016! The […]
PYD04 – Michael Treadwell – InterWorks Analytics Consultant

Michael Treadwell, an InterWorks analytics consultant and former train engineer, talks about Alteryx, Python, R and life on the open railroad tracks.
Questions from Tableau Training: Matching Mark Color
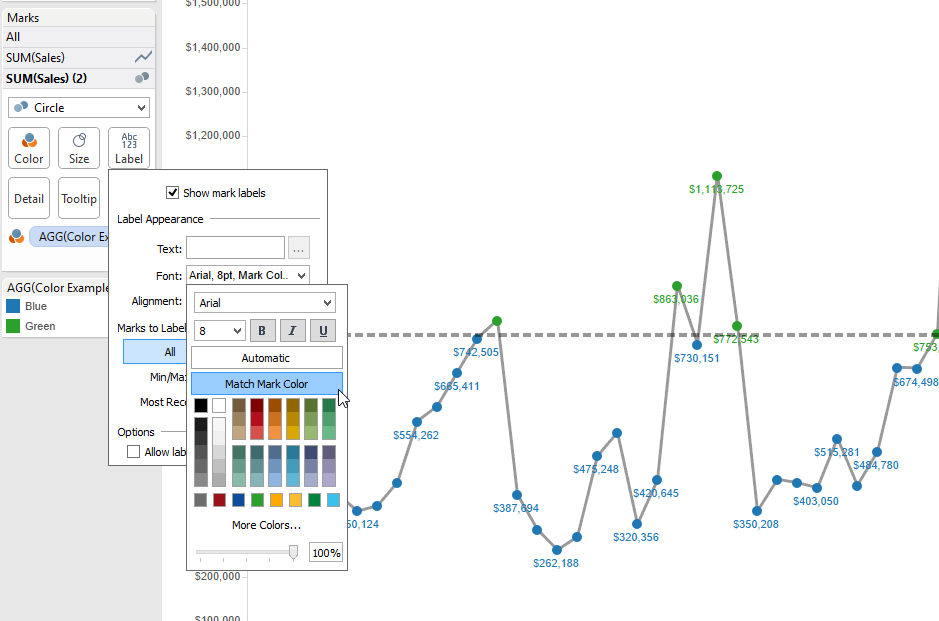
We get lots of questions conducting Tableau trainings across the country. Many of them unveil new functionality that Tableau releases that we as trainers come across first when teaching new Tableau users. The below question has many answers, but I wanted to highlight something from Tableau 9.2 that may have gone un-noticed by some, including myself. […]
Tableau Deep Dive: LOD – LOD Calculations vs. Table Calculations
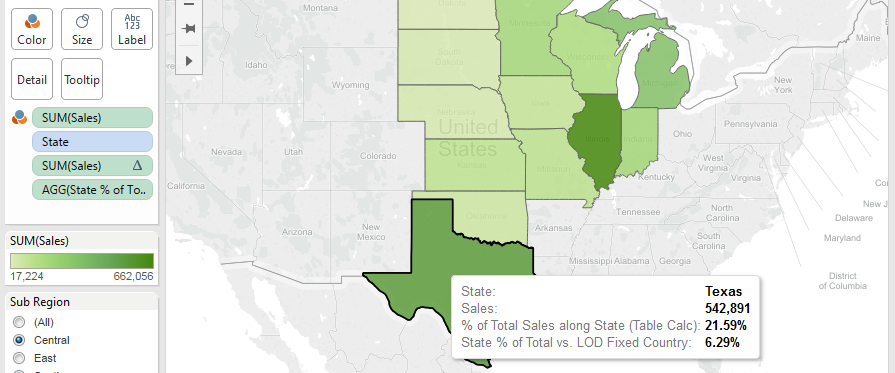
At first glance, it could appear as if there is redundancy between level of detail calculations and table calculations. In fact, you might wonder if you could use table calculations to accomplish much of the functionality for LODs. Let’s consider a simple use case for percent of total. % of Total Use Case We want […]
Tableau Conference on Tour 2016: 3 Thoughts from Sydney
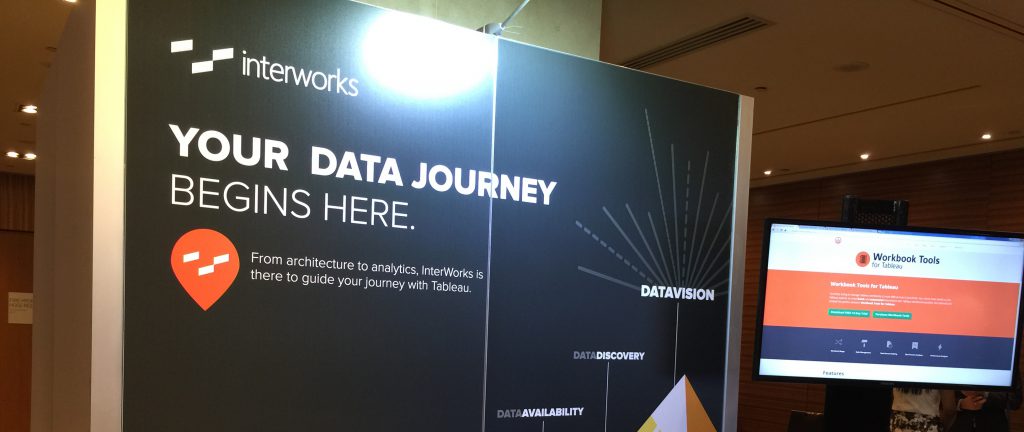
Tableau purchased Power Tools in 2019. Contact Us for more information. The 2016 Tableau Conference on Tour train has begun, and the first stop was Sydney, Australia. Event organizers announced an attendance of over 800 data-crazy Tableau users. This is an even bigger draw than Melbourne last year. The speakers ranged from Tableau Zen Masters to bestselling […]
10 Questions for Tableau Zen Master Jonathan Trajkovic

I met Jonathan at the Tableau Conference in Las Vegas last year. He has a background that includes science and business. He’s an engaging and talented fellow. The Questions Q: When and how did you start using Tableau? Trajkovic: I started using Tableau four years ago when I was a student. In 2005, I chose to study […]
