Tableau Driver’s Ed: Creating a Center of Evangelism
In the previous article of Driver’s Ed, we covered the four phases of the Drive methodology to build an analytics culture step-by-step. The third phase, Foundation Building, details how to use the quick wins achieved in Phase 2 to solidify the base for scaling out Tableau to the rest of the organization. Part of this […]
Alphabet Soup: Understanding Tableau File Extensions
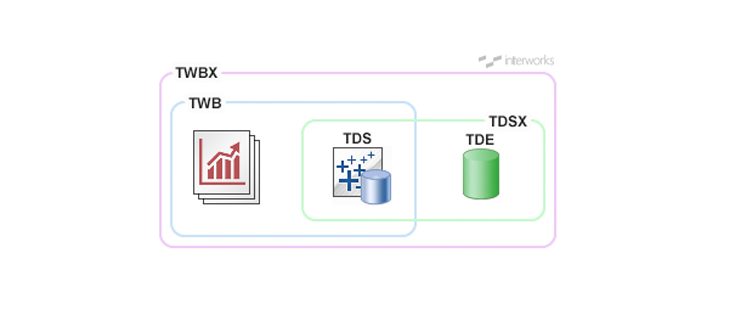
Acronyms, acronyms, acronyms. They dominate the Internet, social media, everything. IMHO, probably too much. And yes, Tableau is no different. It’s all just TMI. To help get you out of WTF and back to LMFAO, I’ve compiled all of the different Tableau file extensions, what they mean and which are the most commonly used. YW. […]
How to Improve Wildcard Filter Performance in Tableau with Wildcard Parameters
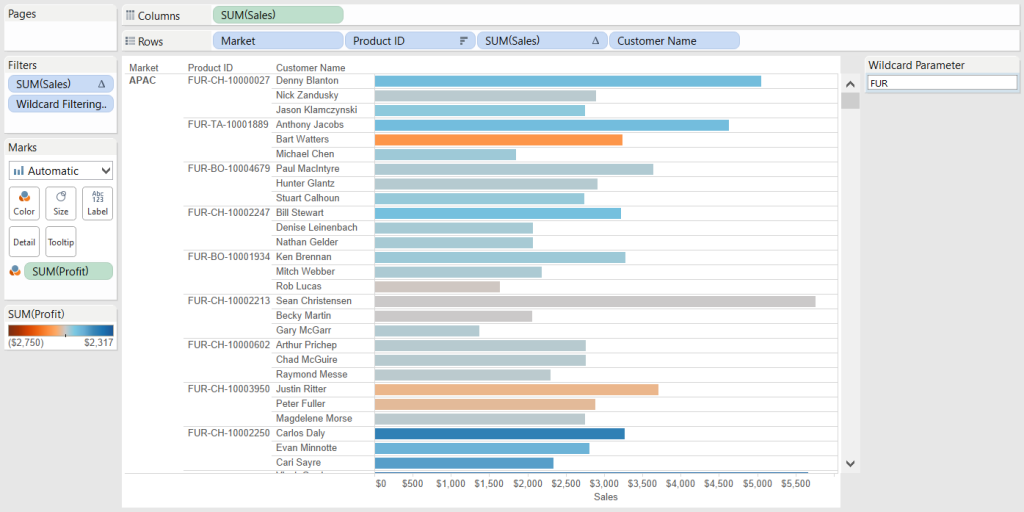
Recently, I was working with a client on a dashboard using a wildcard filter to search for thousands, if not millions, of unique item part numbers. This was a very large company, where a “big” data set meant at least a few billion rows of data, even when using an extract. One of the first […]
Bring Web Data into Alteryx with the InterWorks Import.io Connector
Import.io is the best tool for scraping structured data off the web. Alteryx is the best tool for self-service data analysis. It doesn’t take long to realize that we should put the two together.
PYD05 – Amber Smart – Data Analyst at Life.Church and Tableau Community Ambassador

Amber Smart of Life.Church joins InterWorks’ own Ben Bausili to talk about her journey into full-time problem solving, running a Tableau User Group and data in the church.
Using Comics to Tell Data Stories
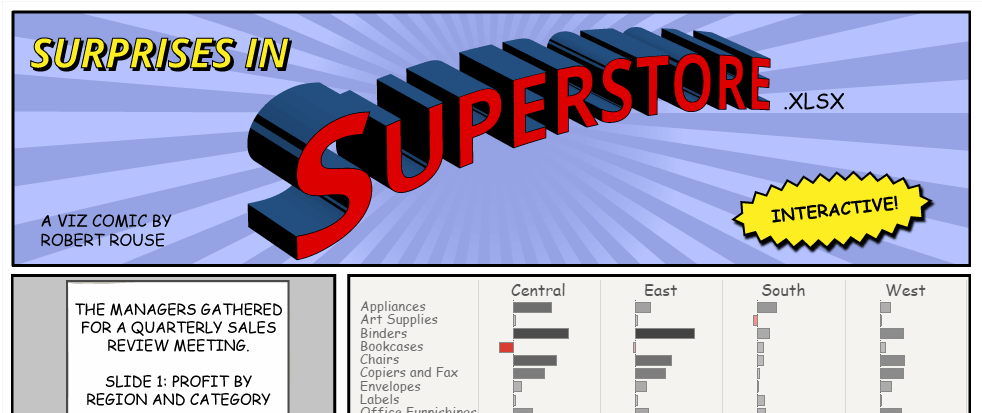
Data stories are about people. We make charts about customers buying things, students earning grades, investors placing trades and on it goes. The people reading and making charts also have stories to tell, but their experiences are hard to describe with numbers and simple shapes. For that, we need something else. The characters in this […]
Questions from Tableau Training: Showing the Null Indicator
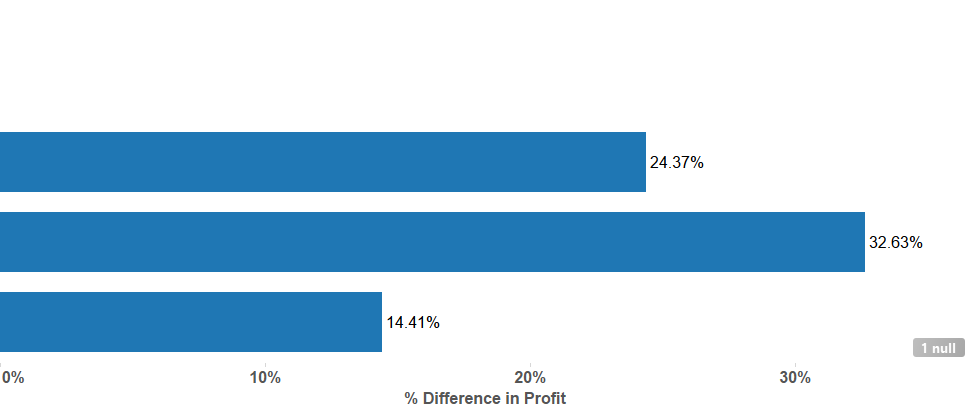
A common question that comes up in trainings is: “I accidentally removed the null indicator, how do I get it back (without using undo)?” Ignoring the null indicator on visualizations can often cause discomfort among end users as they may believe that something is wrong. In certain charts, a null indicator does not mean that […]
The 2016 Stanley Cup Playoffs Matchup Viz
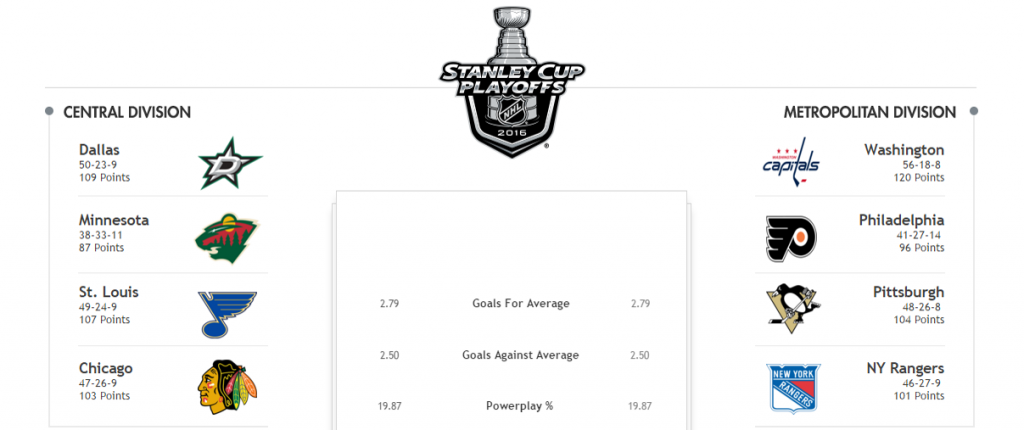
Many of us at InterWorks are avid sports fans, as you can see from our various blog posts and the many examples in the Viz Gallery. While these examples tend to focus a lot on football (pro or college) and various other sports, I wanted to bring a bit of hockey into this blog. What […]
Creating Dynamic Fiscal Calendars in Tableau
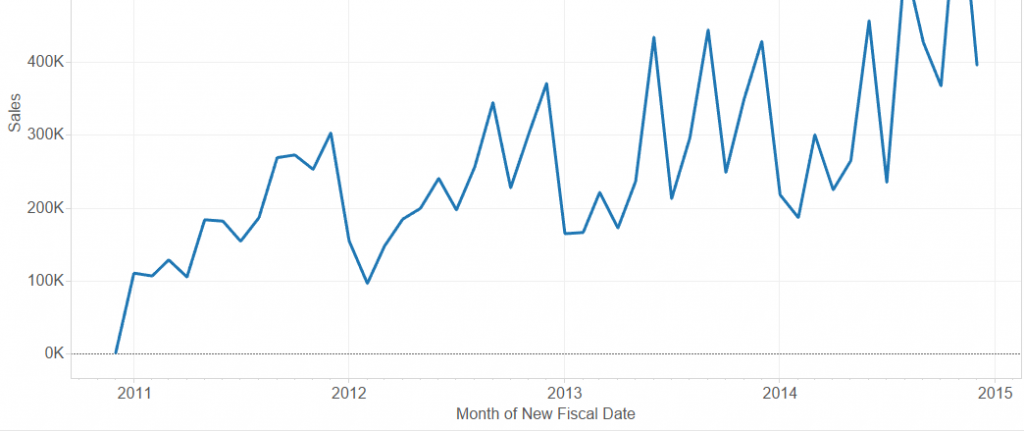
If anyone ever told you it’s not possible to make a dynamic fiscal calendar in Tableau, then you weren’t talking to someone from InterWorks. It may require a few steps, but as is often the case, all we need are a few clever calculations. So, what exactly do I mean by a “dynamic” fiscal calendar? […]
Mapping America’s Deadliest Shootings
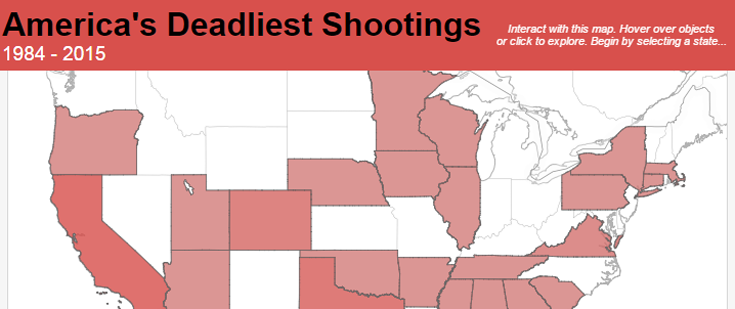
Gun violence has experienced an uptick across America over the past few years, with major incidents increasing five-fold over the past decade.1 In documenting these incidents over time, the Los Angeles Times has put together an informative timeline that dates from 1984 to present. Scrolling through each tragic moment in history, I yearned for an accompanying visualization to summarize this […]
