Analyzing Strava Data: Part 1 – Exporting and Parsing Segments with Alteryx
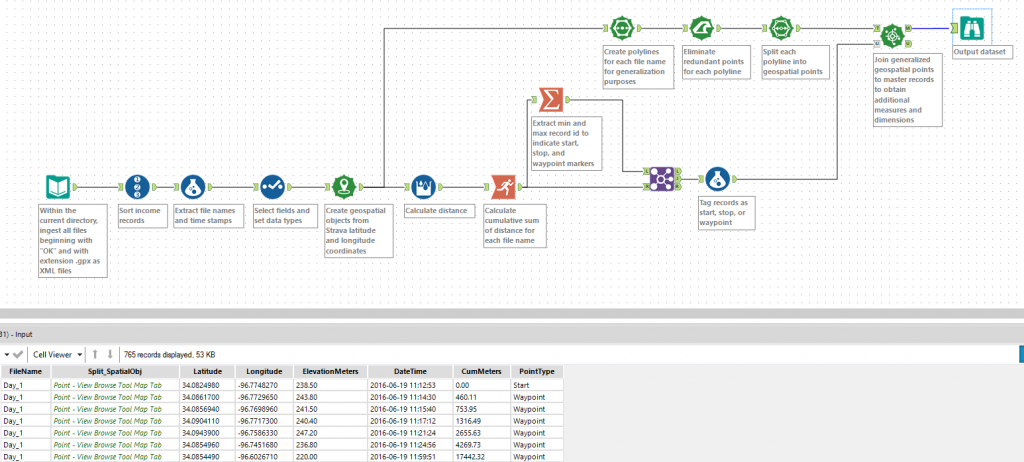
Are you an avid cyclist who regularly uses Strava to track segments and claim K/QOM? Are you a data fiend that yearns to analyze and manipulate fitness tracker data in Alteryx for visualization in Tableau? Well, now you can! In this two-part series, I’ll detail the process I used in analyzing my recent OK Freewheel journey. Step […]
Extract Geological Data Directly into Tableau with Our USGS Web Data Connector
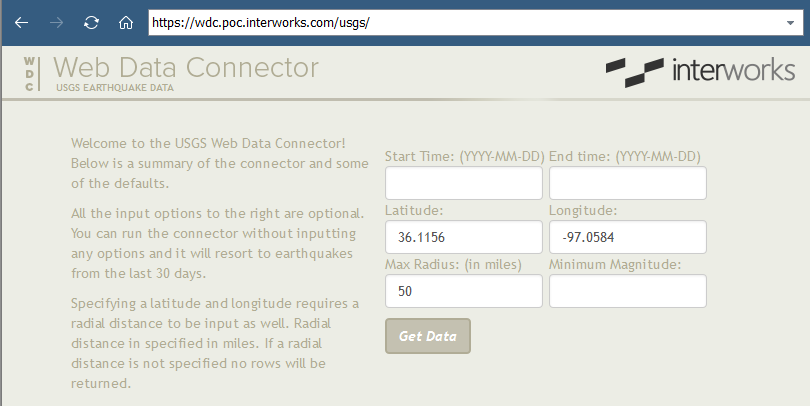
As a data-driven society and Tableau junkies, connecting to your favorite data sources easier is definitely a welcome sight. Tableau does this very well with a slew of standard data connectors. But, what if the data you want to connect to is from a web page? Well, you have options! You might be aware of […]
10 Questions for Alteryx Ace Michael Treadwell

Alteryx Inspire, Alteryx’s annual user conference, ended a few weeks ago. As part of the conference, Alteryx recognized four of the most influential leaders within the Alteryx community today. These leaders are known as Alteryx Aces. We are big Alteryx fans here at InterWorks, and were ecstatic when Alteryx named our own Michael Treadwell as one […]
Wheel of Presidents: A Different Way to Visualize Presidential Data in Tableau
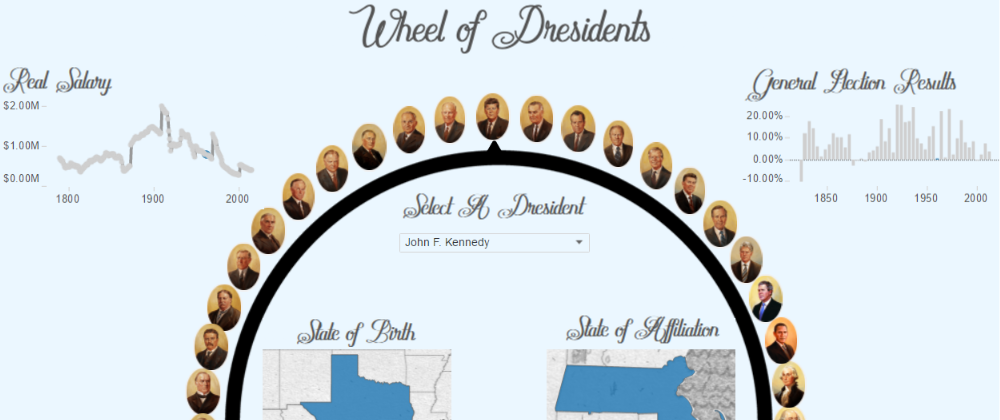
The Drawing Tool has been incorporated into CBI Studio by InterWorks. Explore CBI Studio to see what’s new. People working with Tableau come from many different backgrounds. They’re analysts, data journalists, graphic designers or just curious people wanting an upgrade from their spreadsheet. Regardless of who creates them, I think the best dashboards share one […]
Tableau Conference On Tour – Next Stop: Munich!
Is there a better way to share your passion for Tableau, learn new things by the hour and touch base with the community than visiting a Tableau Conference? I will let you be the judge of that, but after an amazing conference in London we sure are getting excited and ready for the Tableau Conference […]
Politics Viz Contest: Plotting Political Polarization
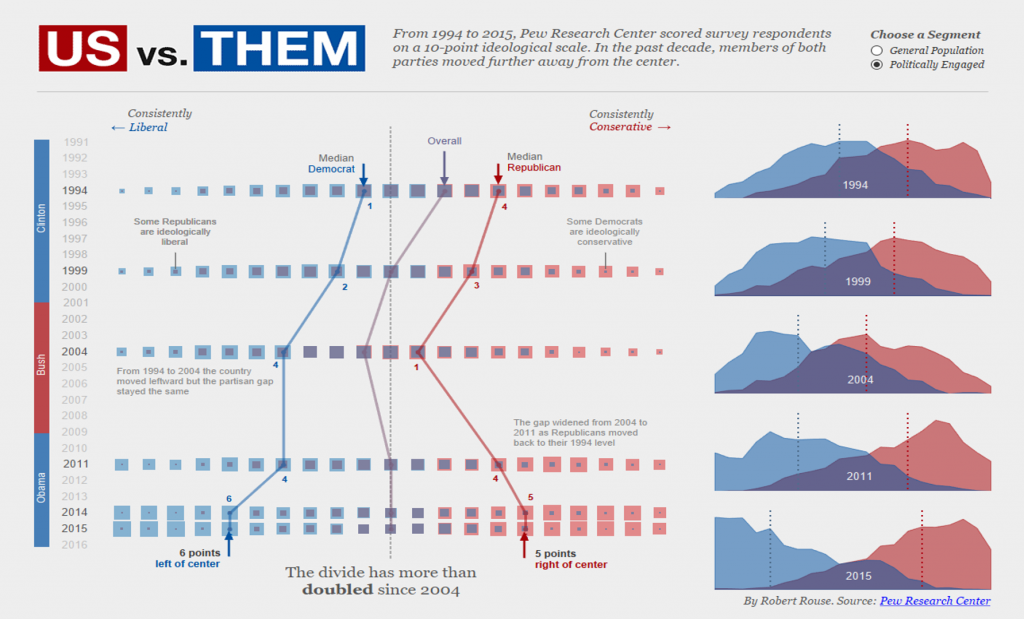
I’m the kind of person who binges on real-time charts during election nights, but not this voting season. My interest is waning because of a sense that political divisions have become deeper, less civil, and less thoughtful in recent years. Is that intuition correct, or have things always been this way? Pew Research Center, an […]
Why YOU Should Volunteer as Support Queen for #OKFreewheel

This week I’ve had the pleasure of attending an 8-day trip across the state of Oklahoma with 22 of my friends (who also happen to be coworkers). These 22 #teamiw brave souls are battling heat exhaustion, treacherous hills, and lots of mechanical problems as they ride bicycles an average of 64 miles per day in […]
PYD10 – Derrick Austin – Solutions Architect, Bee Keeper

On our tenth show, InterWorks’ own Derrick Austin joins Tim and reminisces about always being an early adopter of internet technologies, gets excited about the Internet of Things and the Quantified Office, and explains how bees aren’t that scary.
Questions from Tableau Training: How Can I Get Box Plot Data into a Crosstab?
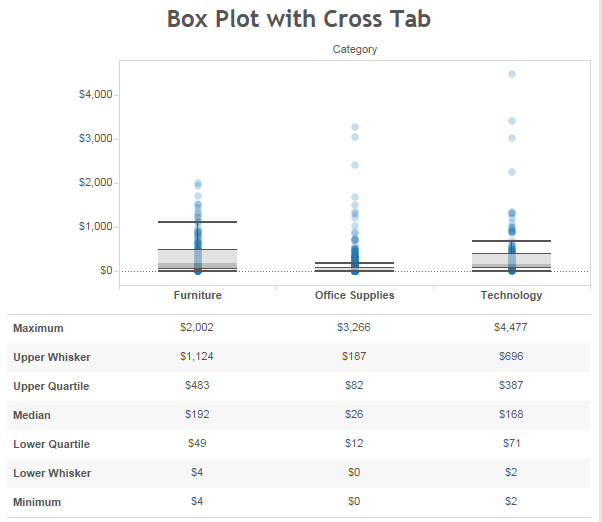
Another great question from one of my Advanced classes as posed by Yelda: “I love box-and-whisker plots, but how do I export that data out? I want to grab the median, the quartiles, everything and put it into a crosstab.” Awesome question! Let’s find a solution. bo Box Plots As a quick review, box and […]
Tableau Deep Dive: Parameters – Table Calculations
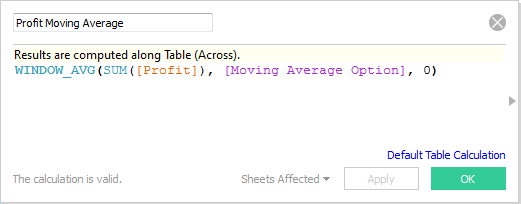
At the start of this Deep Dive series, I stated that there were four standard use cases for parameters: filters, bins, reference lines and calculated fields. What about other areas, such as table calculations? Why can’t we use parameters there? The answer is: You can! You just have to do a little extra work. Let’s […]
