
I joined InterWorks the same day as Ken McBride, and I wouldn’t have described either of us at that point as Tableau black belts — though we’d sure joined the right dojo! Before long, we were both traveling the world doing Tableau training and consulting, and Ken has become known as a Tableau wizard…while after 3 1/2 years I’m still swimming in his wake. Our team has a private forum where we share Tableau tips, tricks, and challenges, and I’ll never forget the time Ken posted a Tableau workbook titled Harry Potter Stuff[1]. It was pure wizardry! You click on things, and different images appear in different places! I recall poking around in it for a while, trying to figure out how it worked [2]. Well, today a client asked me if clicking on a visualization could make Tableau change one viz into another. I built them a quick solution that they liked, and we moved on. That got me thinking about the Harry Potter thing, and I realized I’d never seen anyone post an example of the particular technique I had just used. There are a thousand [3] Tableau tips-and-tricks blogs (and you’re reading the best of them!), so forgive me if this is old news, but let me show you how Tableau can display different visualizations based on user actions.
The technique can be summarized like this: show one chart when no item is selected, and show a different chart when one item is selected. So first we make all the visualizations we need, and we put them into layout containers [4]: 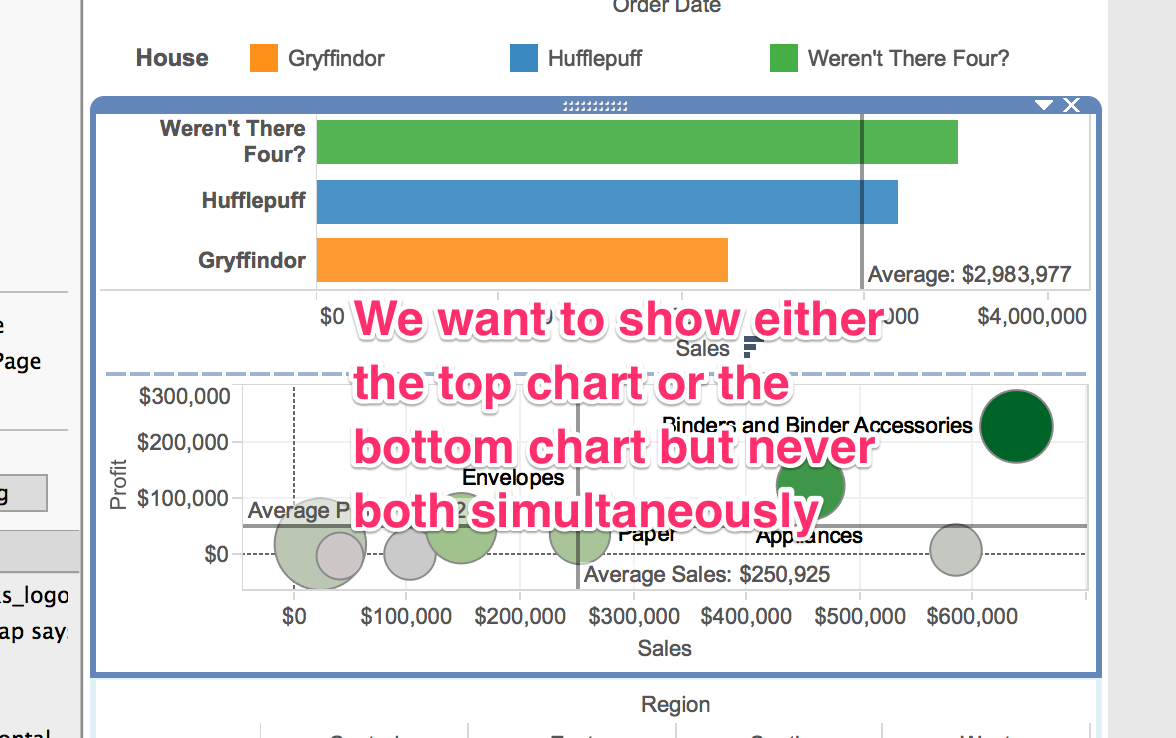 Then we create two Filter Actions:
 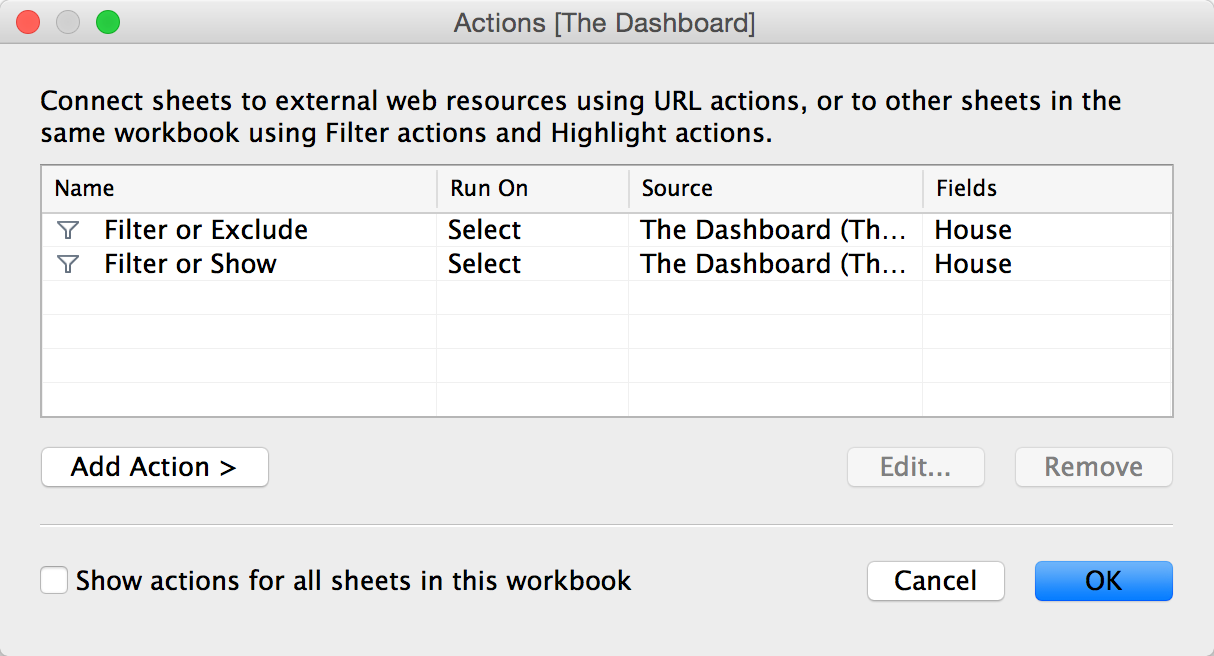 The first looks like this:
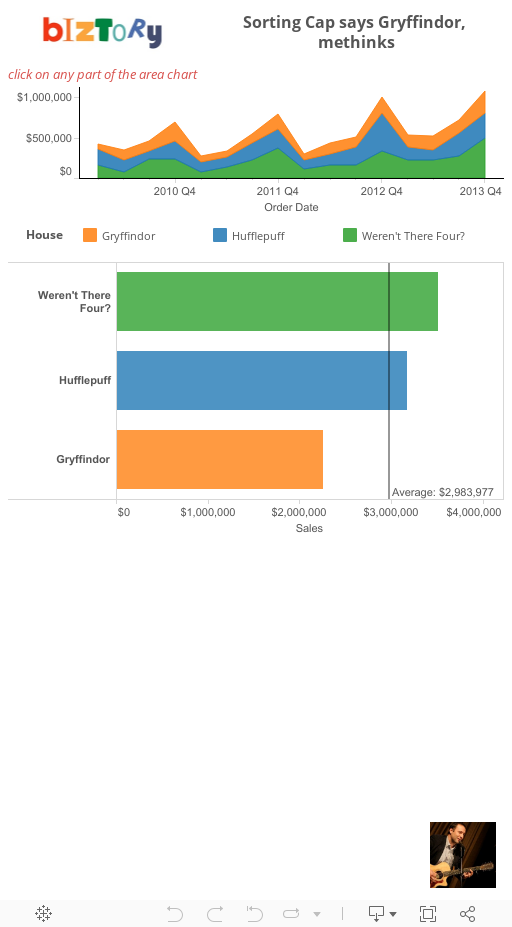
 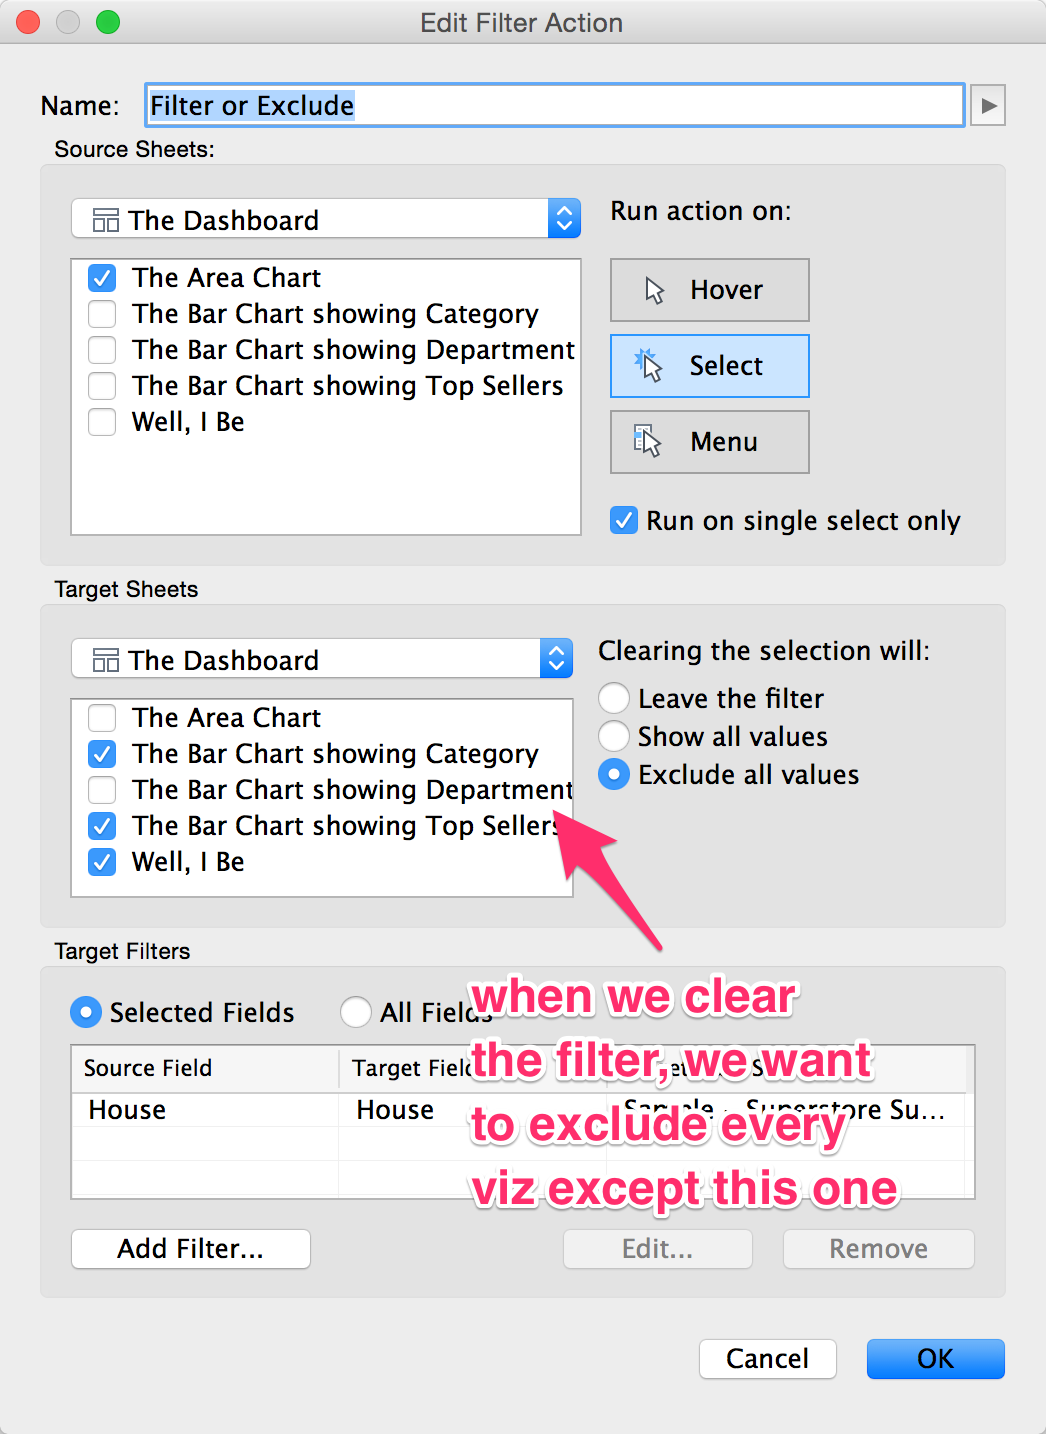 Those three action settings (Hover, Select, and Menu) could better be titled “Don’t Ever Do This”, “When They Click”, and “In the Tooltip.” Run on Single Select means that if you select two or more of the areas of my area chart, I’m doing nothing. I only want this action to occur when they click on one section of the area chart (one House, in this example).
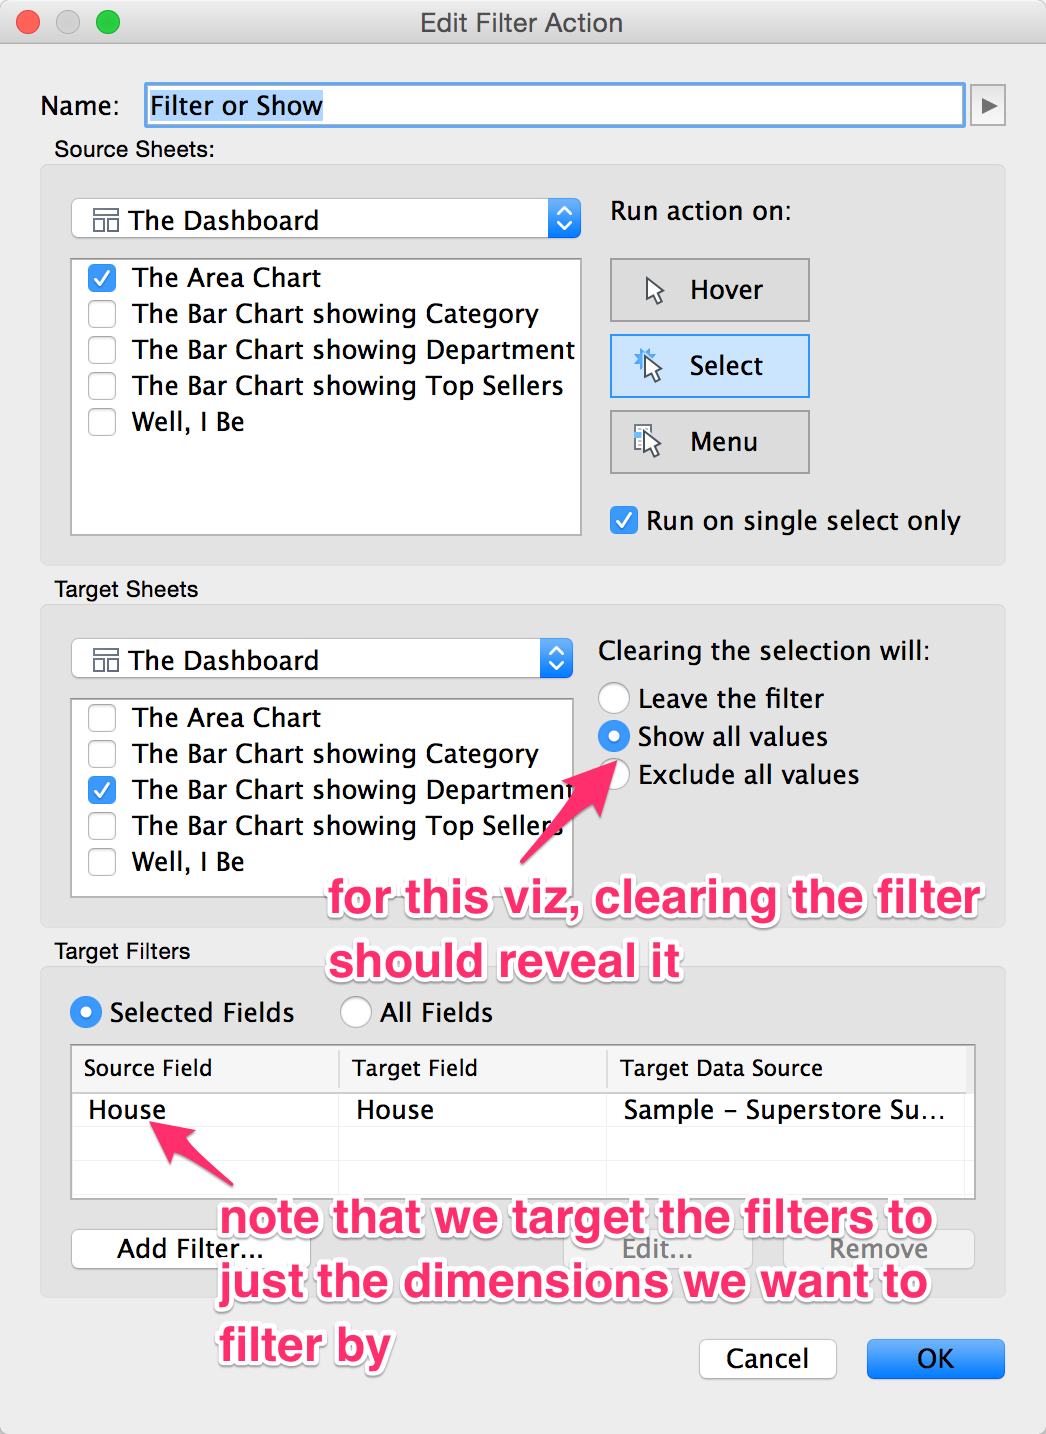
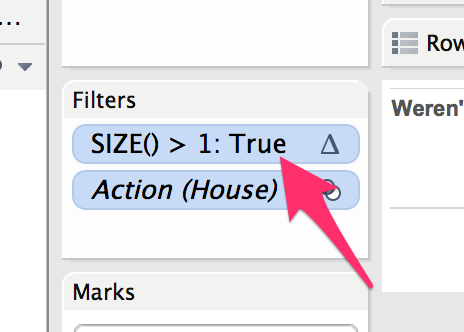
I did this as a type-in calc, adding it first on the Columns or Rows shelf, then dragging it to the Filter shelf. SIZE() (as you can read in Dan Murray’s landmark Tableau book, Tableau Your Data!) tells you the number of rows in a partition. Changing the Compute Using to House counts the number of Houses present in the visualization. Table calculation filters (such as this) are evaluated after all other filters and only impact what gets sent to the visualization renderer. I’ve heard them described as cosmetic filters. This means that if we’ve filtered this visualization to just one House, the visualization will hide itself. Woot. Put it all together, and voila! Your interactive dashboards can display the right visualization for the level of detail your users have selected. Now that’s some Harry Potter **** right there.
Some caveats:
– Worksheet titles don’t hide themselves when the data is hidden. So you have to make “label worksheets” that hide themselves or show themselves based on the Filter Action (see the Well, I Be worksheet). – If you use layout containers instead of floating, you get a spacing issue. If you use floating and have automatic sized dashboards, you may be in for a bad time. Let’s see what they do about dashboard layout in v10…
[1] ^ The word may not exactly have been “Stuff.” But then again I have the memory of a goldfish. [2] ^ Background images restricted to certain dimension values. [3] ^ Give or take a few million. [4] ^ Yes, you can do this with floating, but I’m old school.