The Tableau Wedding Planner
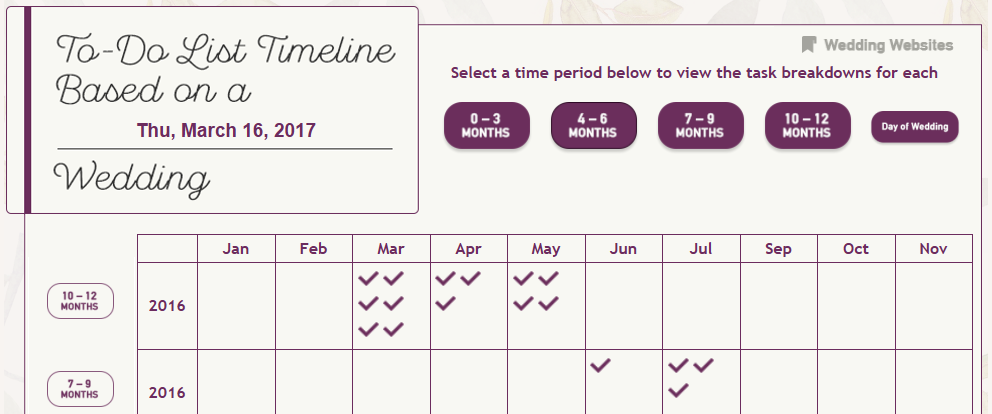
According to www.theknot.com, the average wedding in the United States costs approximately $30,000. With about two million weddings a year, this results in a multi-billion dollar industry. Every time someone says yes, plans must be made. Whether you are getting married at a courthouse, your parents backyard or the Ritz, we all have at least […]
Investment Planning in Tableau: Part 2 – Bollinger Bands
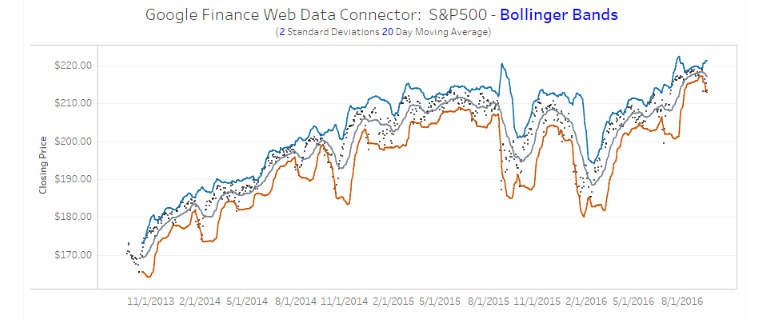
In the first post of this series, we reviewed how you can calculate compound annual growth rates in Tableau. This week, we’ll look at time series data using Bollinger Bands. A technical stock analyst named John Bollinger developed the technique and trademarked the name. Bollinger bands simply plot the moving average of a stock’s closing price. Typically […]
Alphabet Soup: Understanding Tableau 10 File Extensions
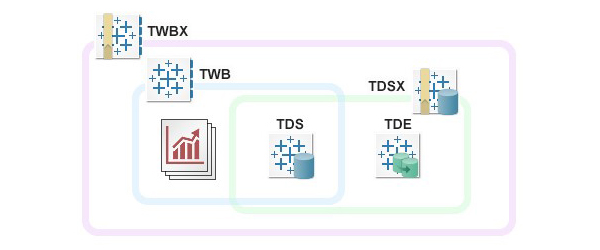
This article is updated with the new icons from Tableau 10 and expanded for additional file types. Previous article for Tableau 9 here. Acronyms, acronyms, acronyms – They dominate the internet, social media, everything. IMHO, probably too much. And, yes, Tableau is no different. It’s all just TMI. To help get you out of WTF […]
Questions from Tableau Training: Can I Create Text Hyperlinks on a Dashboard?
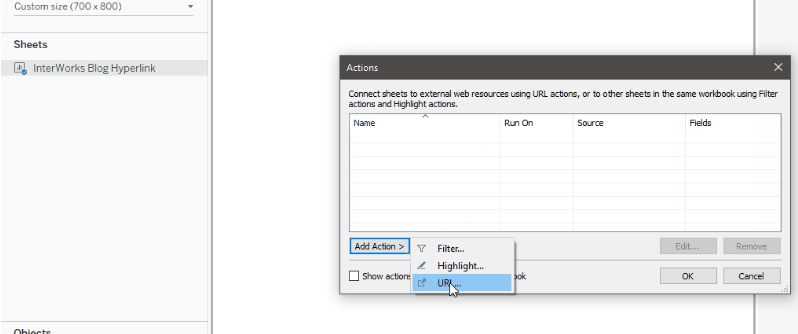
Here’s a question I often get in my Tableau training classes: “How do I create friendly text hyperlinks on a dashboard that open to an external webpage?” You may know how to bring a text object onto a Tableau dashboard, but what if you want your users to be able to click on that text […]
PYD16 – Dan Murray – Evangelist and Author
We’ve got Tableau Conference coming up, so we’re celebrating with a rerun of our original show. Dan Murray is a Tableau evangelist and author of “Tableau Your Data!”
Alteryx Batch Macros – Email Customized Reports to a List of Users
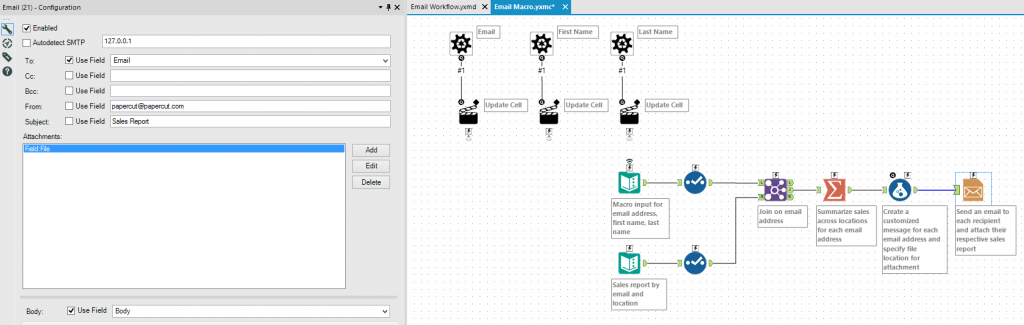
Have you ever had the pleasure of emailing customized sales reports to 25 regional managers? How about 100 customers? It probably took a nice chunk of your day clicking the same buttons in Outlook and verifying you’ve attached Joe’s sales report to Joe’s email address. Ever wish for an easy button? With Alteryx batch macros, […]
Questions from Tableau Training: How Can I Use My Current Report to Create a Viz?
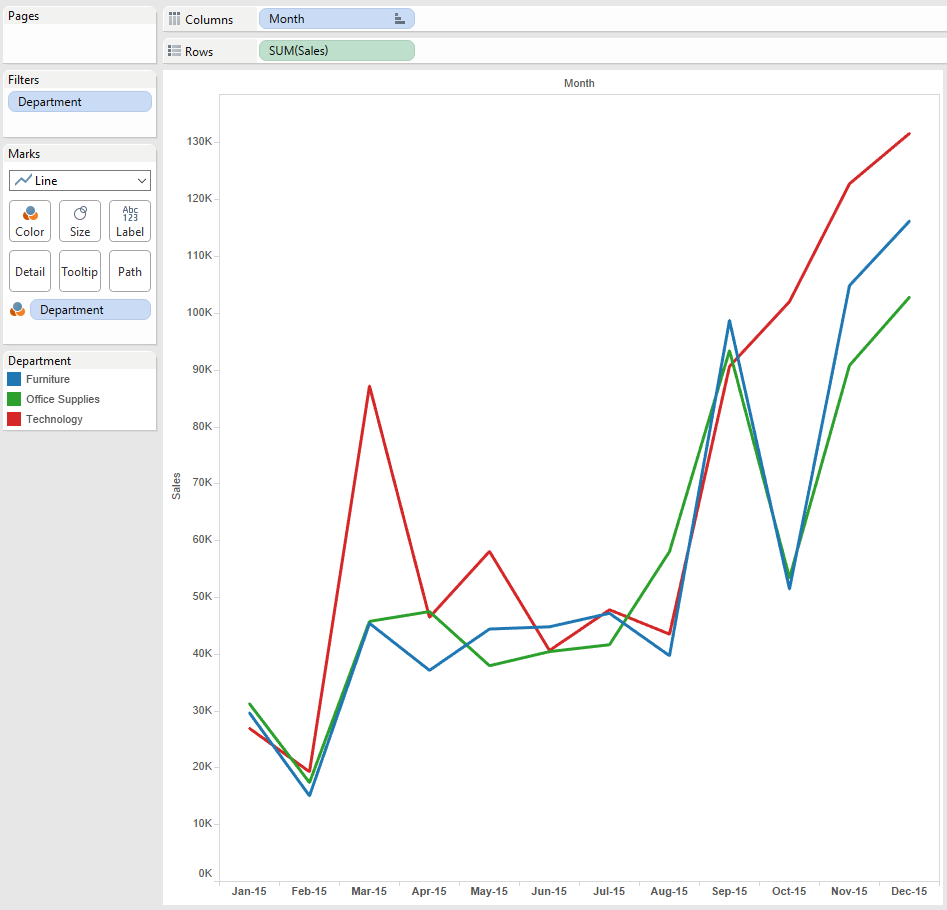
Often times during training, students approach me with a pretty understandable issue. “I already build this report. How can I use my current output to build a visualization in Tableau?” My initial response is: “Let’s see if we can access the original data. Using the transactional database will allow for additional (and easily repeatable!) analysis.” But what […]
Off-Label Uses for Measure Names and Measure Values in Tableau
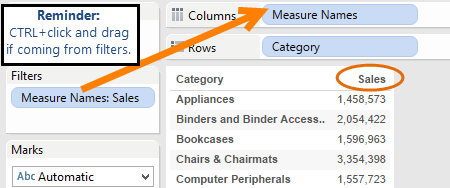
Sometimes, I feel like I’m cheating the system when I find a neat way to use something that Tableau has to offer. Other times, I feel like a genius for doing an end run around them. Is that bad? Well, either way, I’m here to show you how to use Measure Names and Measure Values […]
InterWorks Blog Roundup – August 2016

Greetings, friends! As you may already know, the InterWorks blog is jam-packed full of IT and data goodness. Whether you come here for Tableau, Alteryx, data warehousing, Dell, VMware, you name it, we’ve got a little something for everyone. We’re not ALL business, of course; we have plenty of other blogs that showcase who we […]
Investment Planning in Tableau: Part 1 – CAGR
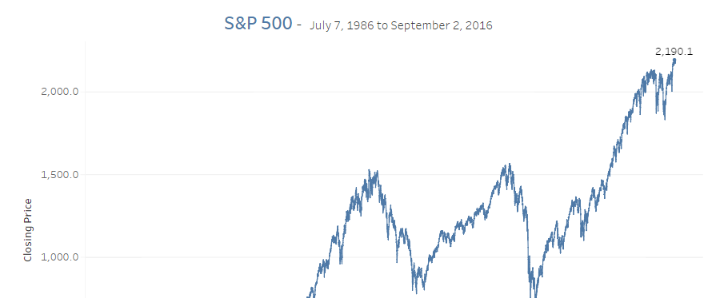
Every decade, I spend a few weeks planning the next 10 years. This thinking normally encompasses career and investment goals. This time, I decided to expand my time horizon. I’m 57 years old, so I wanted to start thinking about what my personal financial situation looks like in 10–20–38 year time horizons. Why 38 years? Well, […]
