5 Ways to Prepare for Your Tableau Consultant
InterWorks is the most awarded and experienced Tableau consultant in North America. We’ve won the Tableau Partner of the Year for three consecutive years and become Tableau’s first Training Partner of the Year back in January. Our business intelligence consultants are working with the largest and most advanced companies in the world. We believe we […]
Open Data Viz: The Chicago Divvy Bike Station Tracker
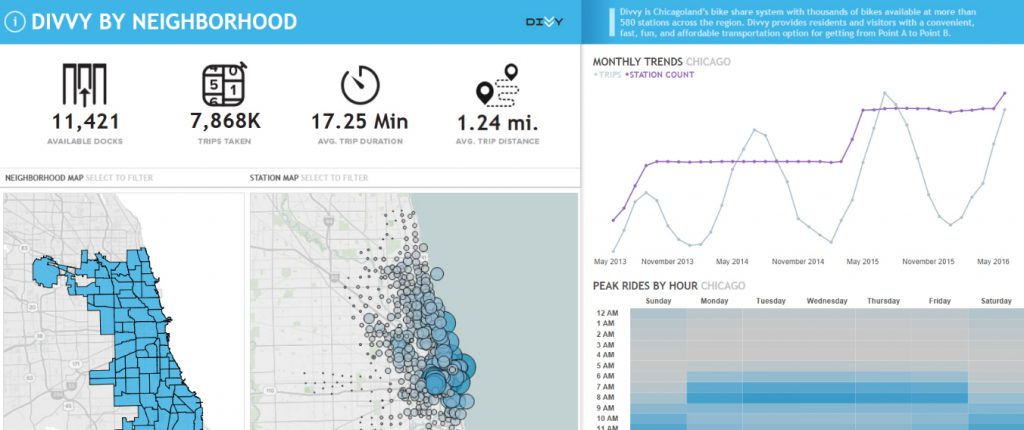
Divvy Bikes, Chicago’s fantastic and vast bike sharing program, gives both local commuters and tourists alike an alternative option to Public Transit or taking a cab. My goal for this dashboard was to create a comprehensive guide to get to know your neighborhood Divvy. The dashboard allows the user to navigate by neighborhood and Divvy […]
Assigning Shapes to Non-Present Values in Tableau
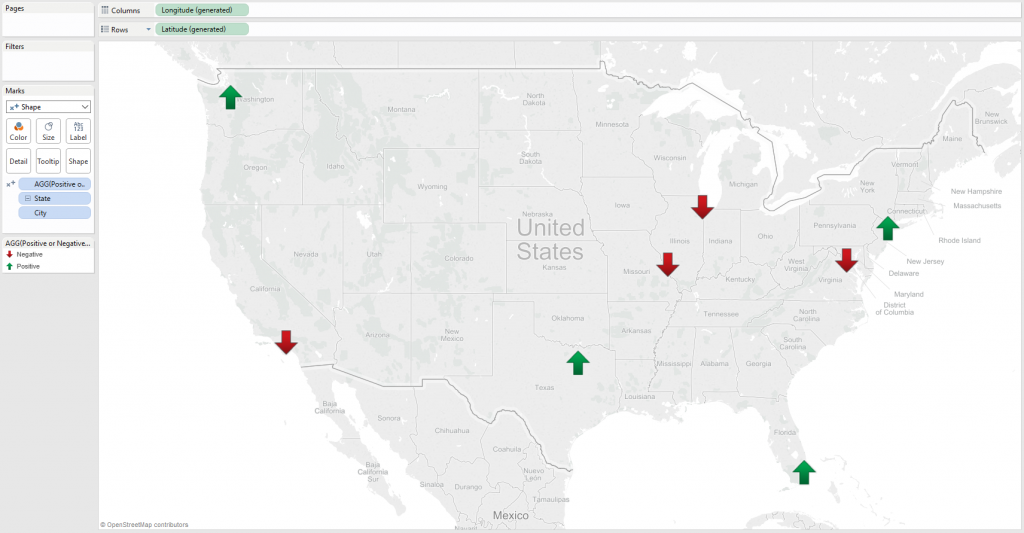
When building our dashboards, one of the best ways for us to visualize positive and negative values is through the use of shapes and colors. But what if our data doesn’t have both positive and negative values? And what if we’d also like to ensure that everything would work properly given the introduction of new […]
Questions from Tableau Training: Can I Move Mark Labels?
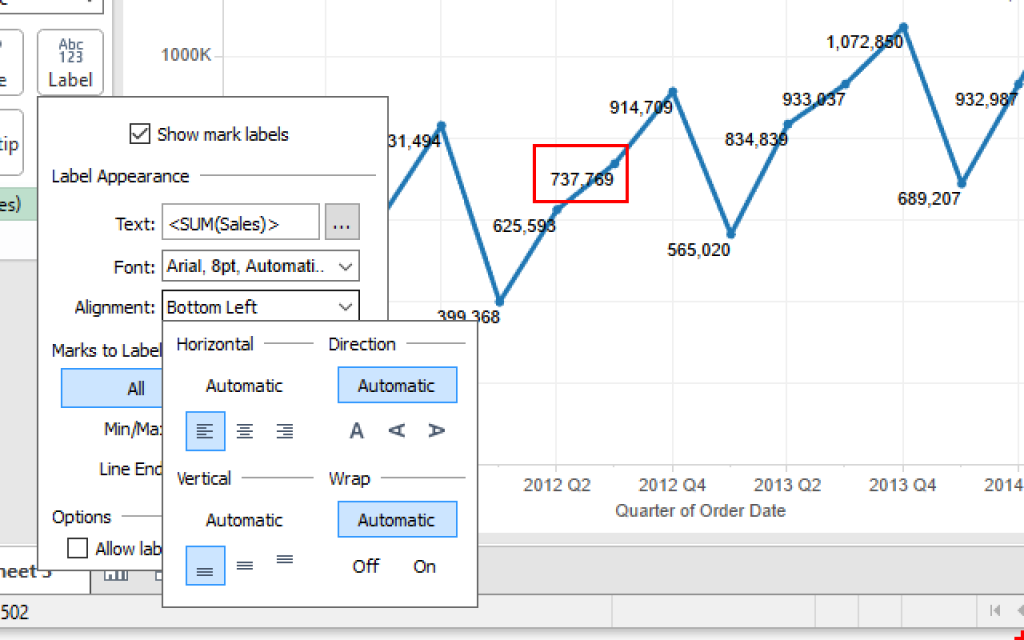
Sometimes Tableau puts mark labels exactly where we want ‘em… But sometimes the default positioning of mark labels leaves class participants asking: “Can I pick where my mark labels go?” The answer is yes! You have two options for adjusting positioning for your mark labels: Adjust the alignment using the Label button Click directly on […]
Easily Connect to Government Data with the Socrata Web Data Connector for Tableau
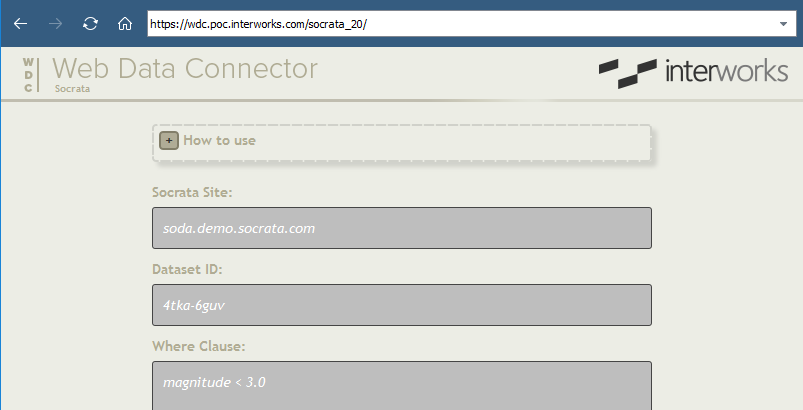
Do you want an easy way to compare NASA’s meteorite tracking data with your own UFO sighting adventures? Maybe you would like to combine food service inspection violations for restaurants in your area with your credit card statements, instead. The good news is that it’s now easier to connect to governmental data in Tableau and […]
How to Compare Quarters on One Complete Timeline in Tableau
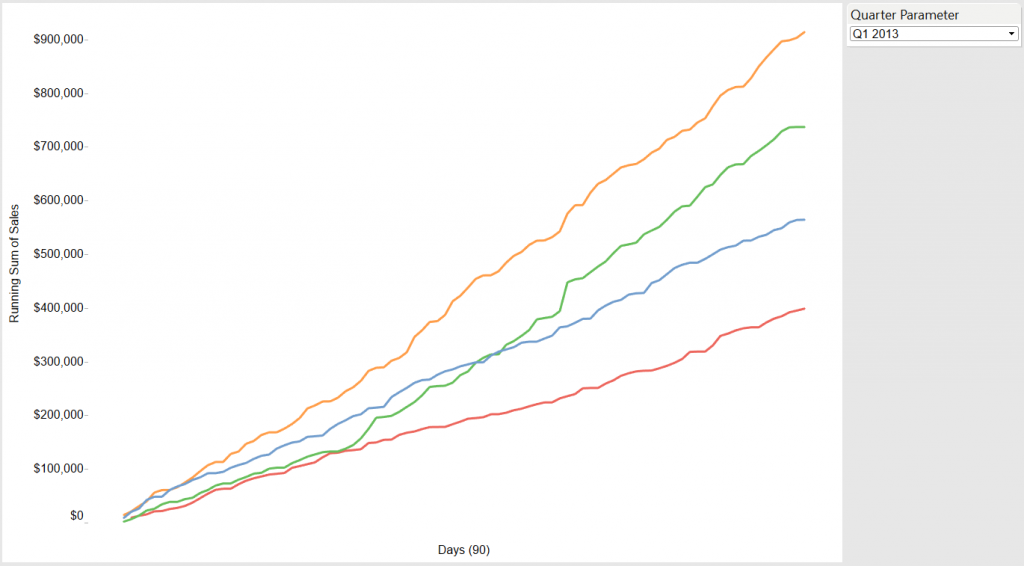
I was working with a client recently, and they asked me a seemingly simple question: “How do you compare quarterly performance across a single time frame in Tableau?” They were looking for this: My first thought was that this is very straightforward – all you should need to do is drag the performance metric to Rows, […]
What’s New in Tableau Server 10
With the imminent arrival of Tableau 10, I thought that it’s time to take a quick look at all the new features and functionality that will be made available with Tableau Server 10. Minimum Requirements Firstly, let’s look at the minimum requirements. There is no longer a 32-bit version of Server or Worker Server, so the […]
Exploring Broadway Data in Tableau
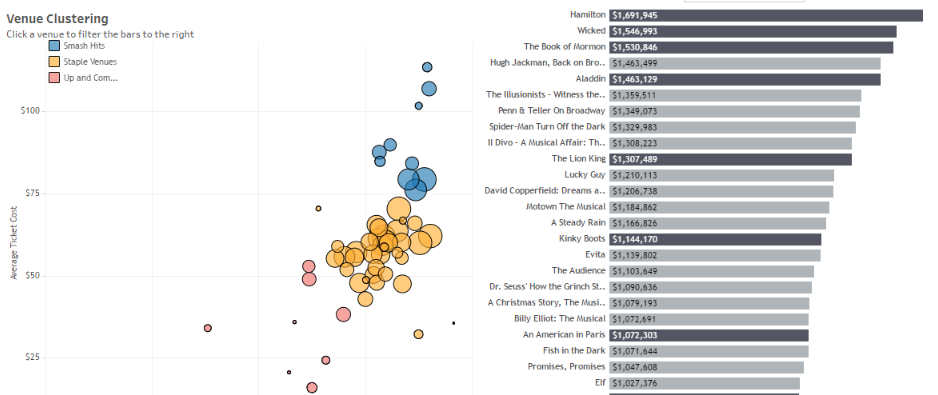
With the non-stop talk around NYC about “Hamilton,” I figured it’s about time to look into some Broadway data. As someone who is not well versed in the theater community as a whole, it’s been interesting to see many people (myself included) become so enamored by Lin-Manuel Miranda’s pivotal work. My initial thought was to look […]
PYD13 – Matt Chambers – Tableau Social Ambassador and Analyst

Matt Chambers, aka SirVizALot, stops in to talk with Derrick about how he got started in data, the pros and cons of using tile maps, and what book he has on his desk right this minute.
Watch Dan Murray’s ‘Discovery & Ad Hoc Analytics with Tableau’ Webinar
Last Thursday, InterWorks Director of Strategic Innovation Dan Murray presented a webinar with Carahsoft on discovery and ad hoc analytics in Tableau. The webinar was targeted specifically to government organizations, but the topics covered can be applied to a wide variety of organizations. Specifically, the webinar details: The data landscape Easy unions of large CSV files Data […]
