When building our dashboards, one of the best ways for us to visualize positive and negative values is through the use of shapes and colors. But what if our data doesn’t have both positive and negative values? And what if we’d also like to ensure that everything would work properly given the introduction of new data?
For this example, I’ve created a simple data set that contains City, State and Profit.
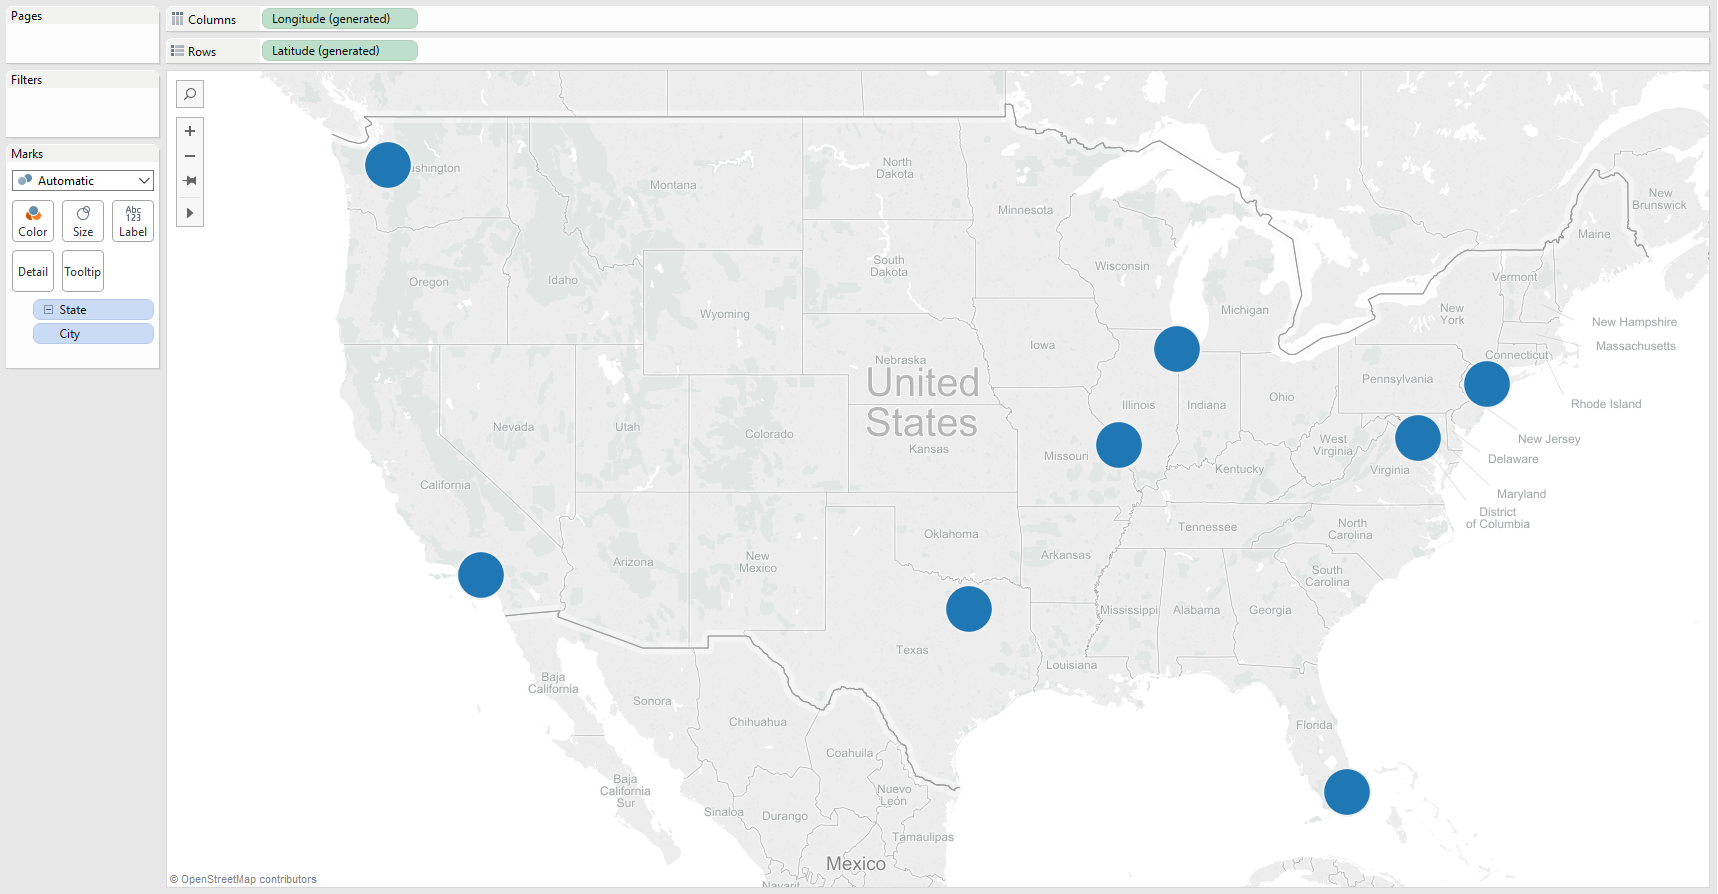
Let’s show our cities on a map, by double clicking on our City field:
For this viz, we want to show whether profits in a city are positive or negative. We can create this formula to do so:
'IF Sum([Sales]) >= 0 THEN "Positive" else "Negative" END'
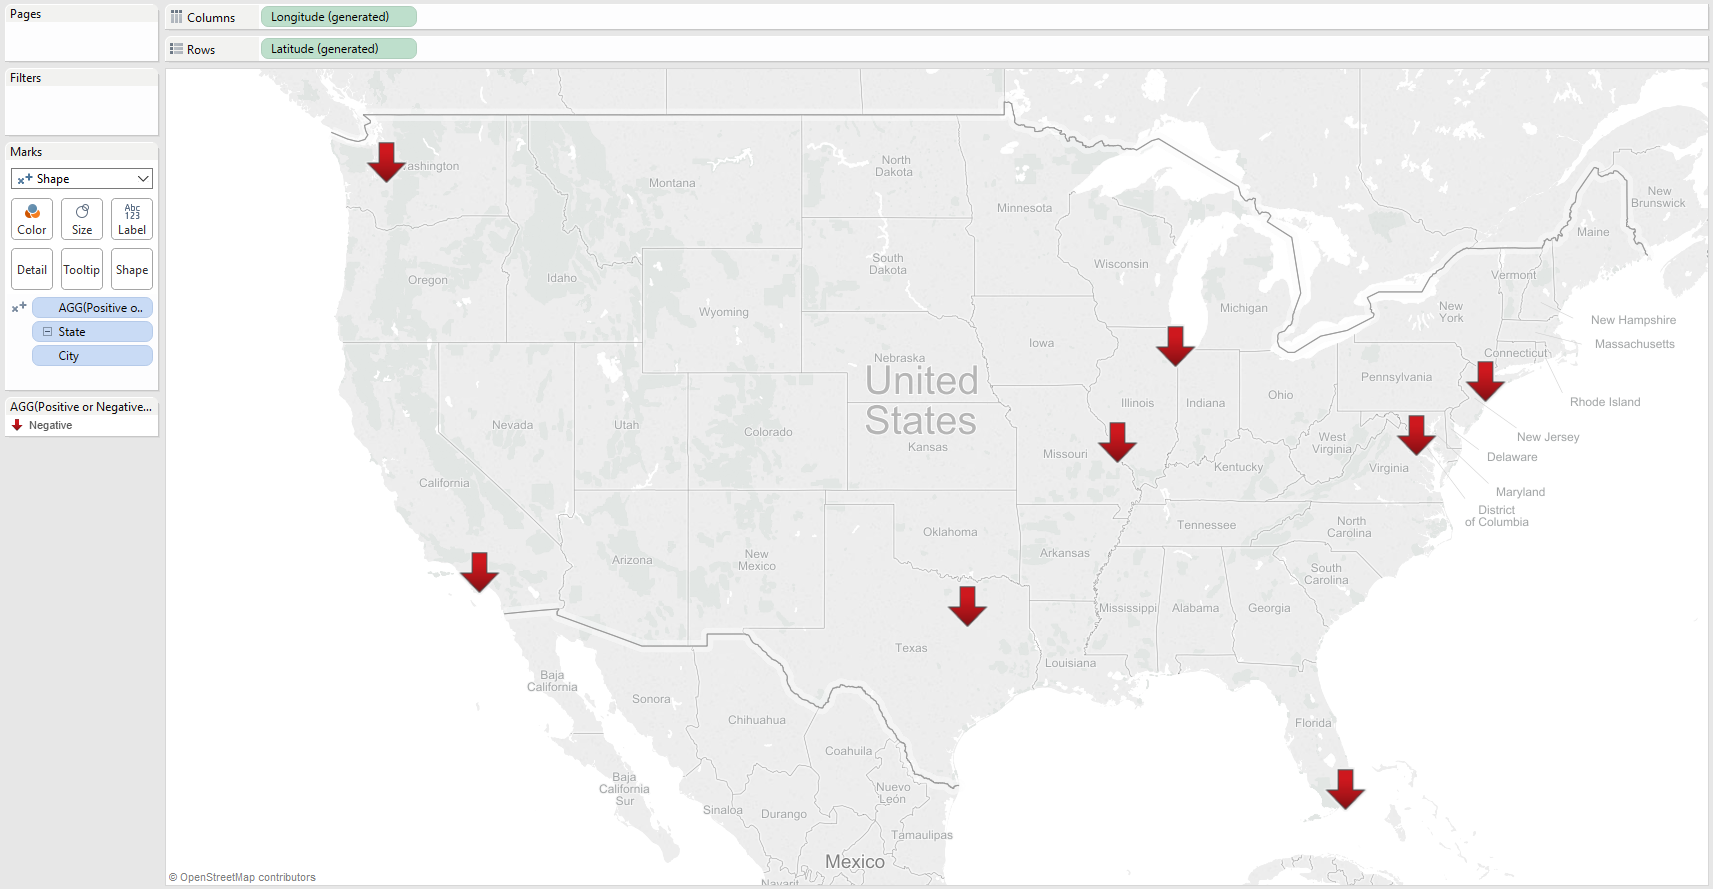
Once we have our calculated field, let’s change our Marks from Automatic to Shape and use our Positive or Negative calculation on our Shapes button. Let’s also change our shape to an upward facing arrow:

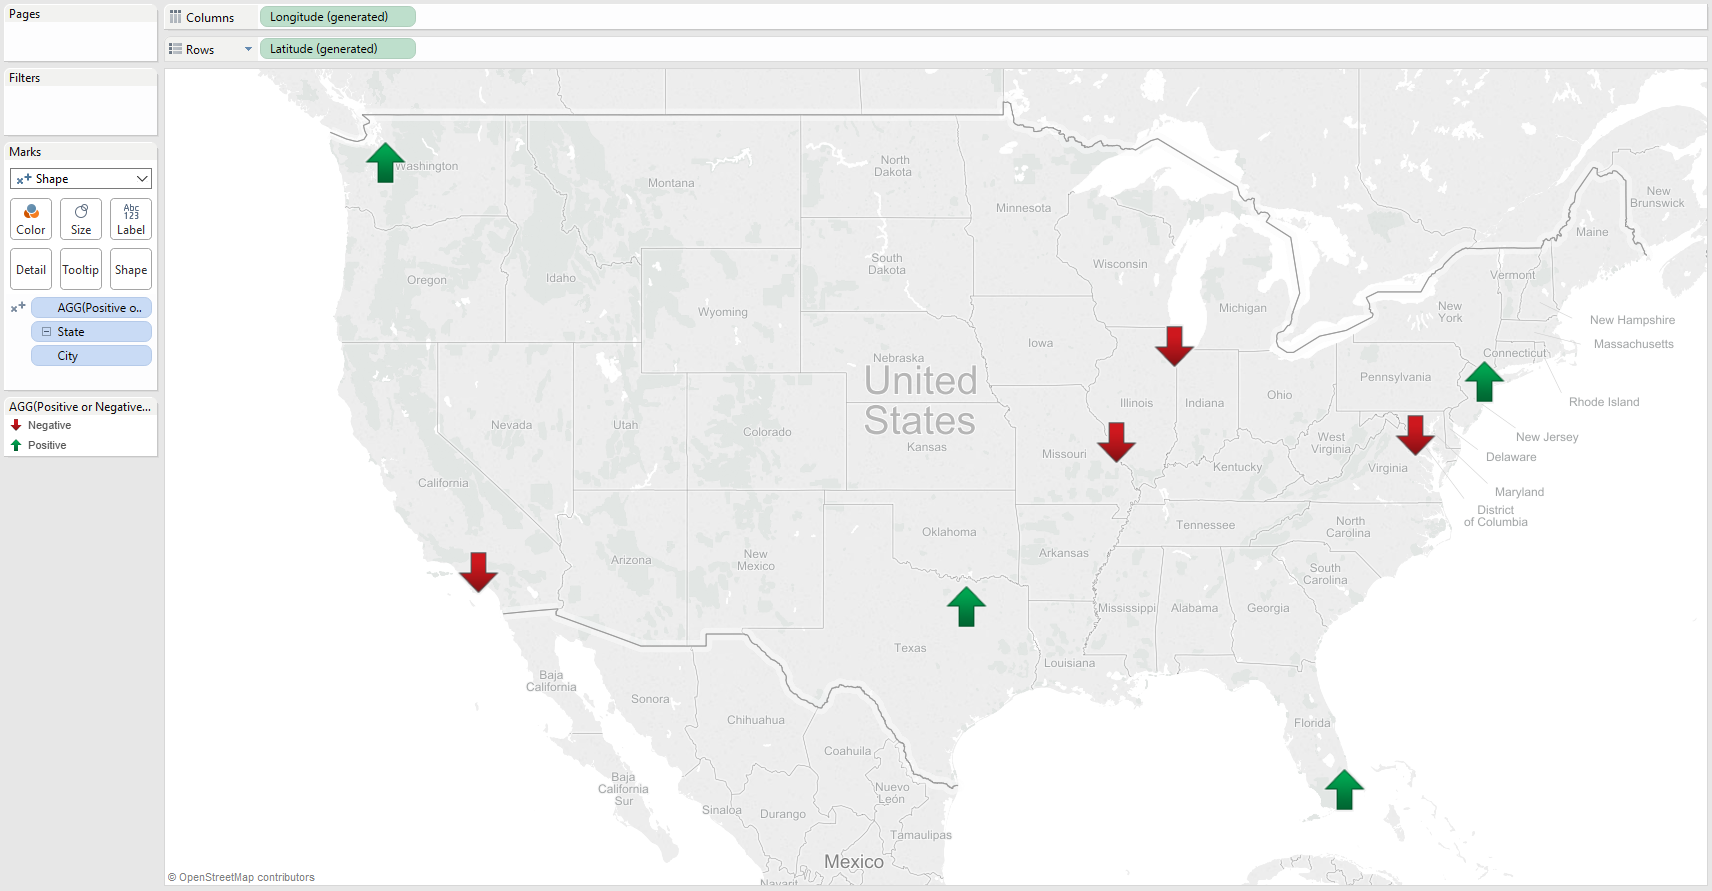
But what happens next month, when our data changes and profitability in certain cities is negative? When we refresh our data, our negative values unfortunately won’t use an intuitive shape:
While we could just update our shapes accordingly, wouldn’t it be better if we could avoid this situation entirely? Let’s go back a few steps to before we refreshed our data.
Enabling Intuitive Shapes
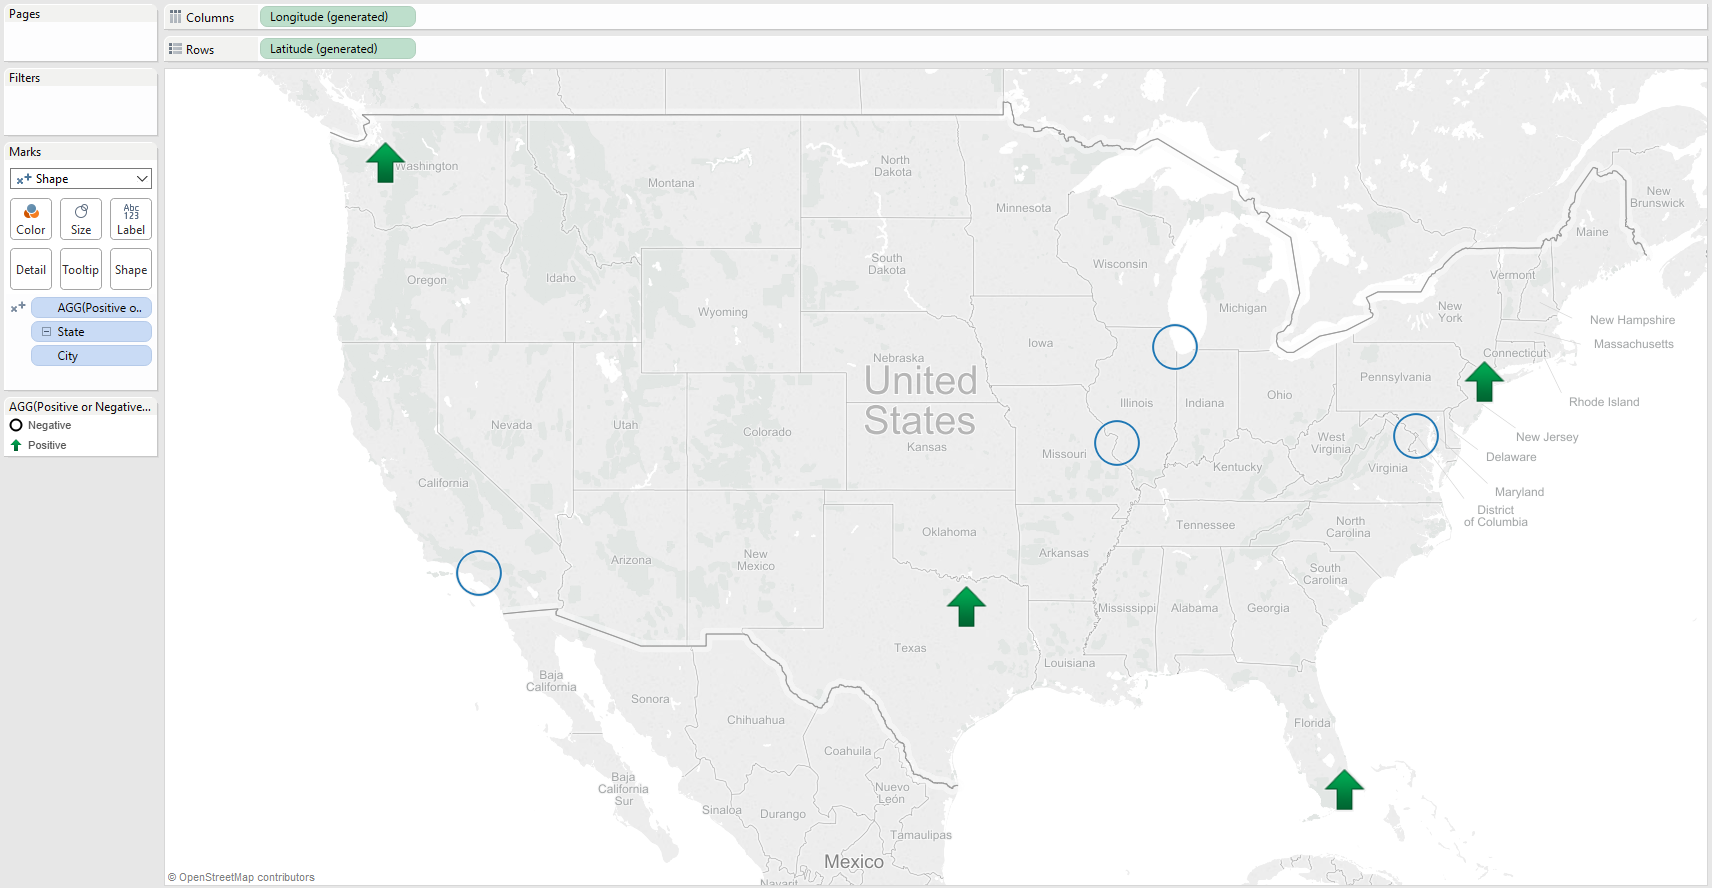
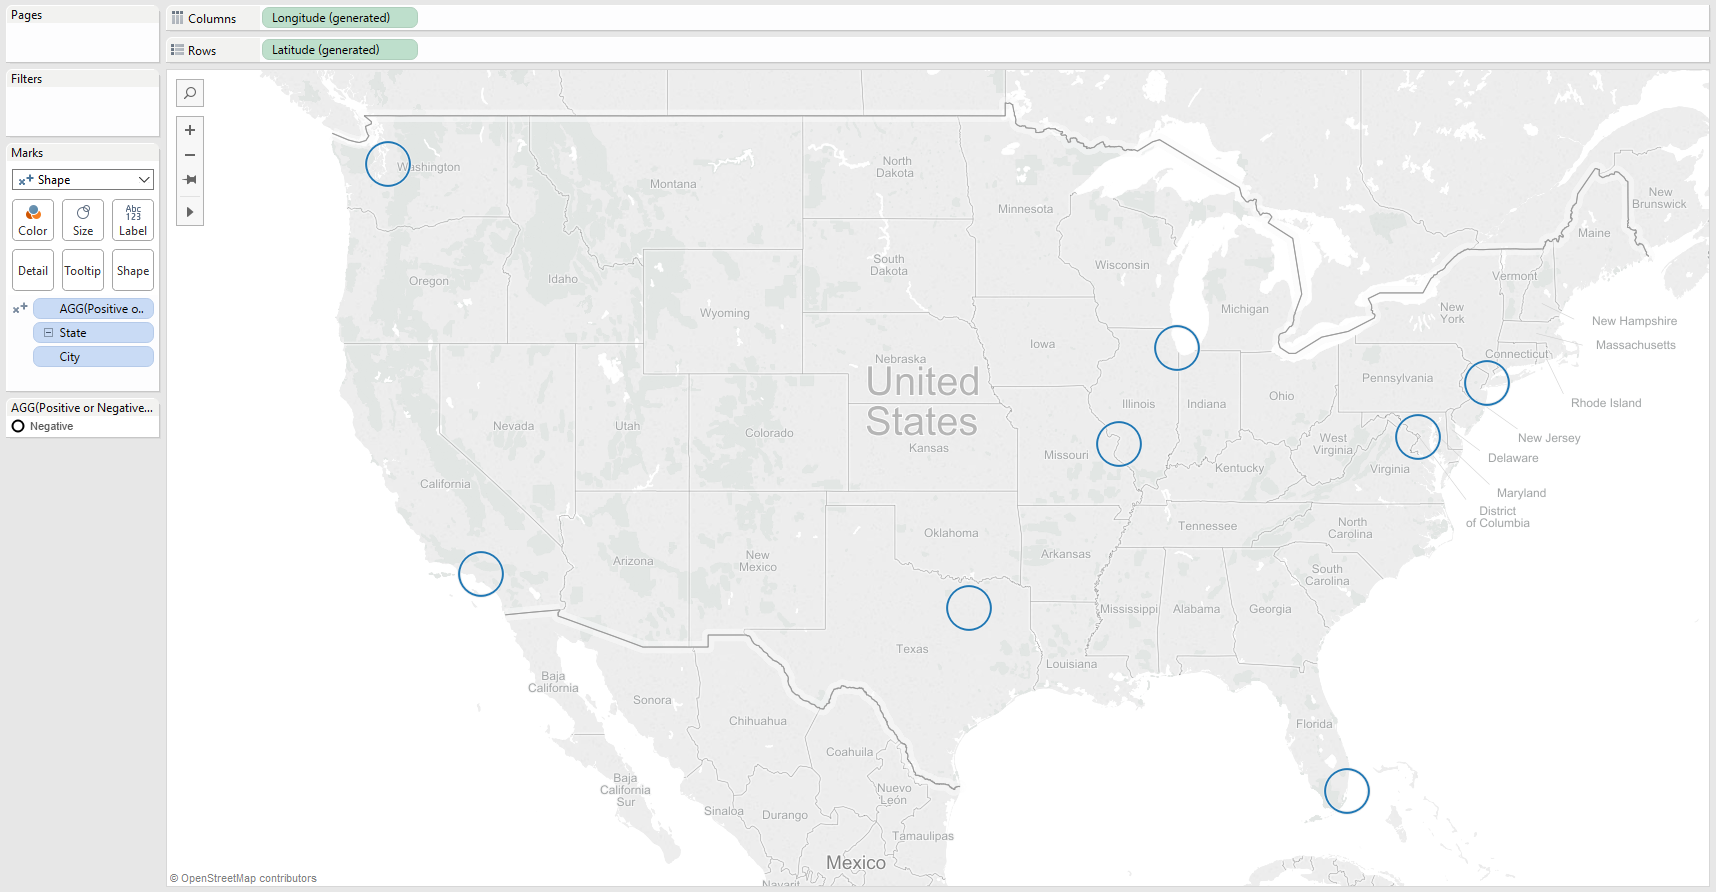
In our original map, all of our values were positive; so we were able to assign the proper shape to our Positive data values. Once we assign the proper shape to positive, let’s then alter our calculation slightly so that it returns negative values.
This time, let’s use the following calculation:
'IF -Sum([Sales]) >= 0 THEN "Positive" else "Negative" END'
Note the addition of the minus sign in front of our Sum([Sales]), this will return the OPPOSITE of Sum([Sales]) and in turn make every value negative.
At this point, we can assign a shape to our negative values and correct our calculation:
Notice how our upward facing arrows return?
Now, when we update our data that includes negative values, Tableau will remember our downward facing arrows: