
Quite frequently, students in training will ask “How do I make a gauge in Tableau?” While it’s possible, it’s not one of the default chart types in Tableau and can be somewhat time consuming. Instead, I recommend using bullet graphs, but why? What is it about bullet graphs that make them more appealing than gauges?
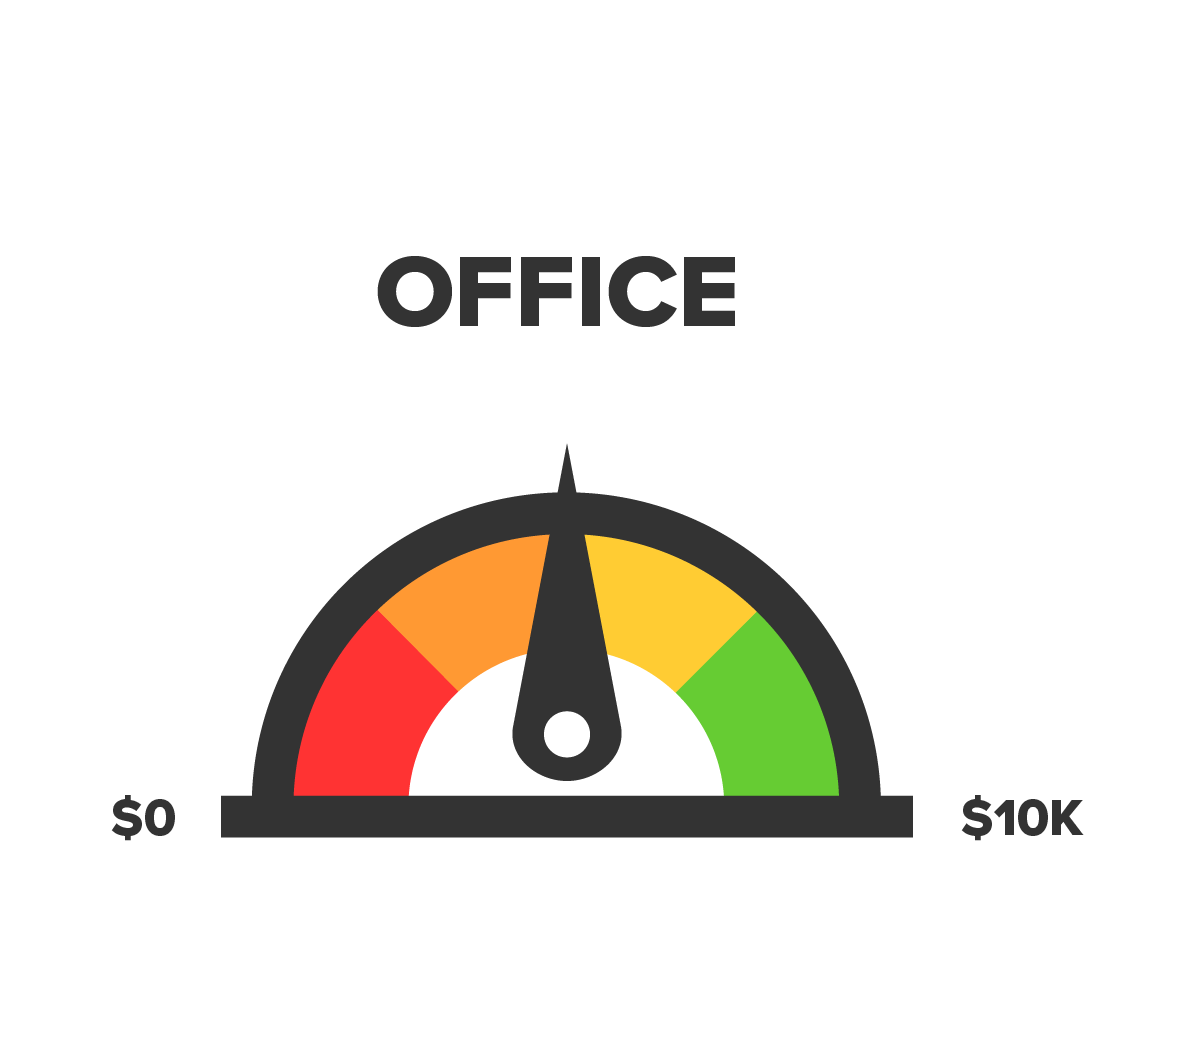
Let’s compare the two. I’ll begin by drawing two gauges, each showing sales quotas. Which department is performing better?


Most students will agree that Office is outperforming Technology. This completely makes sense! Office is in the green, meaning it’s closer to our goal therefore making it better. But is there more to this story? Gauges take the scales of both of our sales and force them on a 0 to 180-degree axis. Let’s add labels and see if there’s more to this story:

As it turns out, our Technology quota is significantly more aggressive than our Office quota by tenfold. However, our Technology sales are much higher than our Office sales. These two pieces of information are extremely valuable but easily lost when using gauges.
To put it simply, gauges make it difficult to compare values across different categories.
This is where the value of bullet graphs becomes clear. I’ll recreate the above, except using our recommended chart type instead:
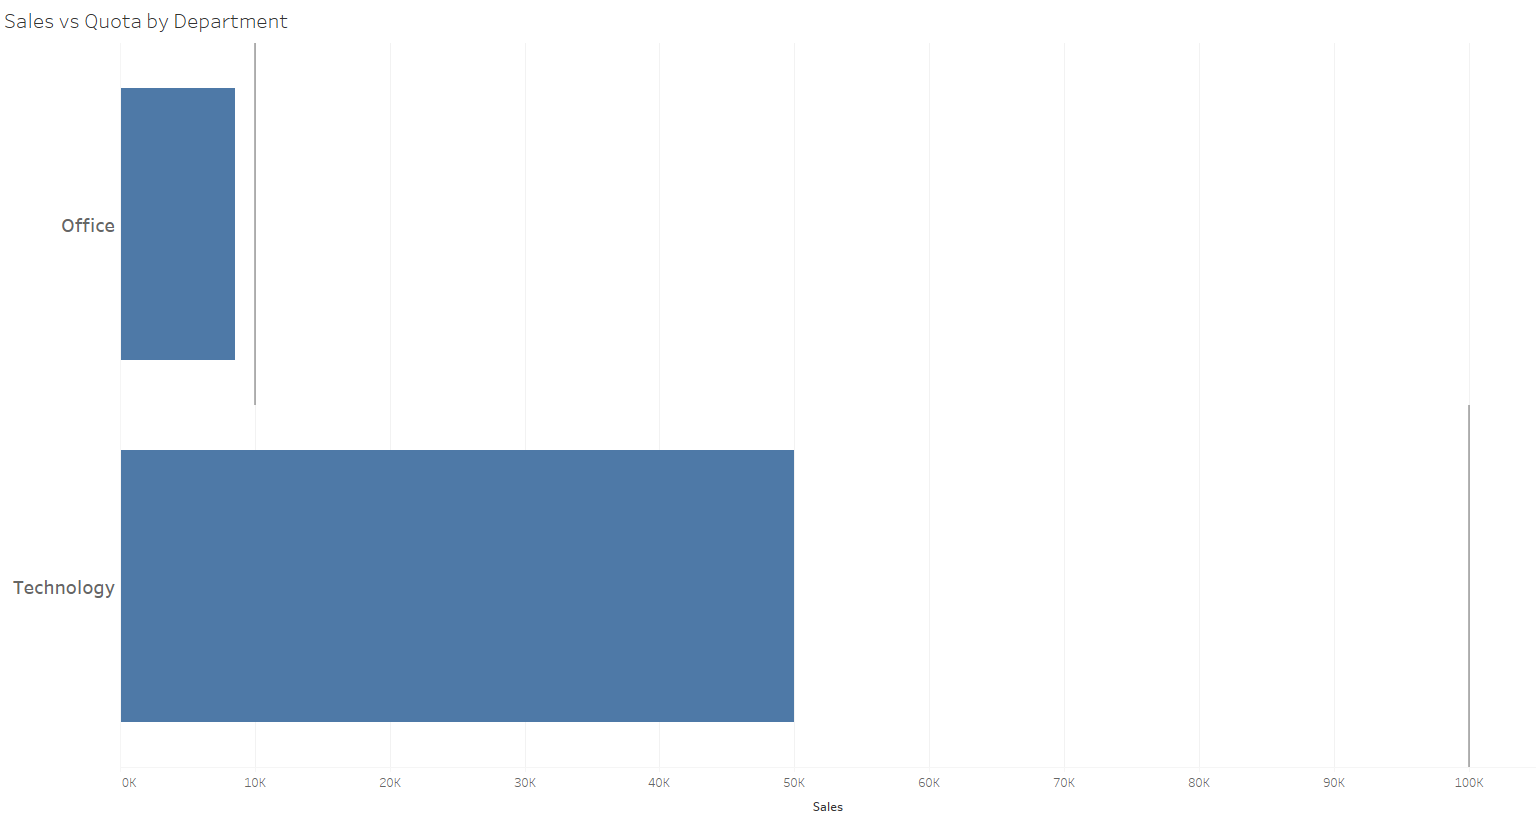
Here, we can see that our Office Sales are significantly closer than Technology to our quota but with some additional context: Technology sales are blowing Office out of the water! It’s extremely easy to compare the values between our sales across departments to their respective quotas.
Also, what if we had more than just two departments? Bullet graphs allow for better use of space. Below is another example of the use of bullet graphs, showing multiple departments you may see in a big-box retailer:
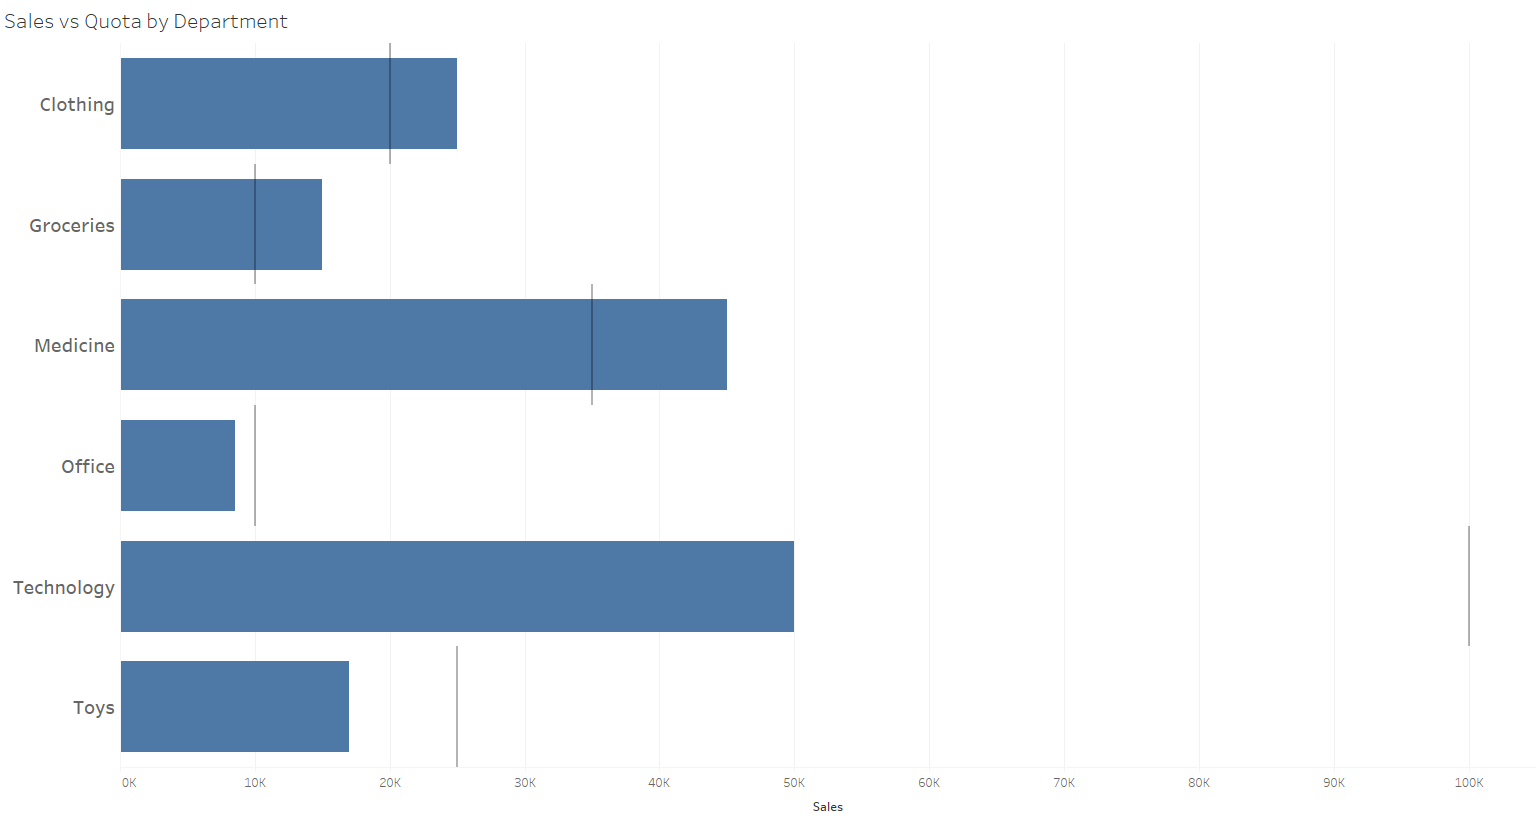
Could you imagine having six gauges on a single report?