How I Went from Nonprofit Maven to InterWorks Director of Employee Experience

For twelve years, I was part of something so special, so greater-than-myself, that I assumed I would never, ever want to leave. I was fortunate enough to be on a team of do-gooders running a nonprofit that offered services to child victims of abuse, and every day was a roller coaster of tragedy and triumph. […]
Data Viz: Women Elected to US Congress
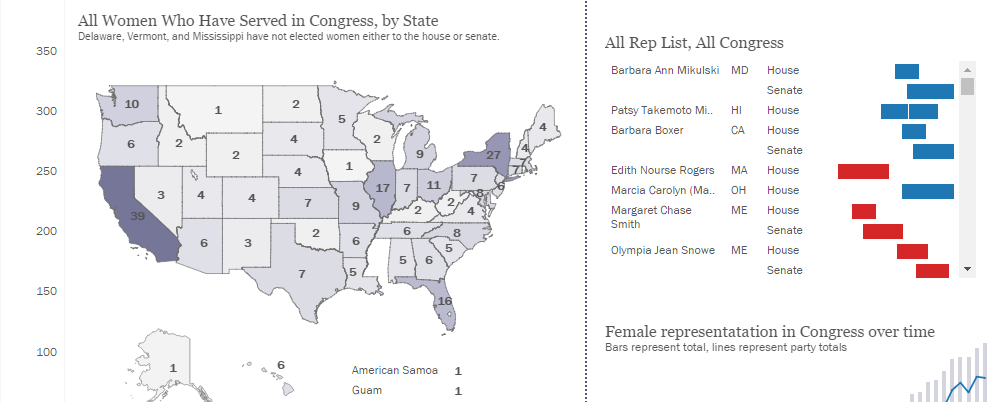
In 2016, the U.S. had an historic presidential race between Donald Trump and Hillary Clinton, the first woman to run for U.S. president. While we’re still waiting on a female president in the U.S., the race led me to wonder about women in other areas of political leadership and government. Thanks to congress.gov and the […]
Data Viz: Most Popular Streams on Netflix 2016
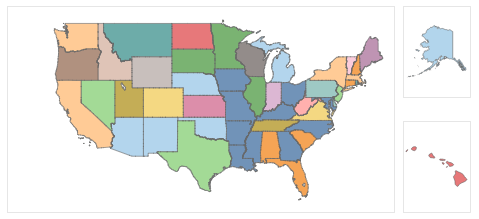
This morning, while reading my RSS feeds, there was an interesting map showing Netflix streaming activity by state published by HSI. The visual didn’t make it easy to see the most popular show incidence. In a few minutes, I created this view in Tableau that does:
How Community Development Created Power Tools for Tableau: Server
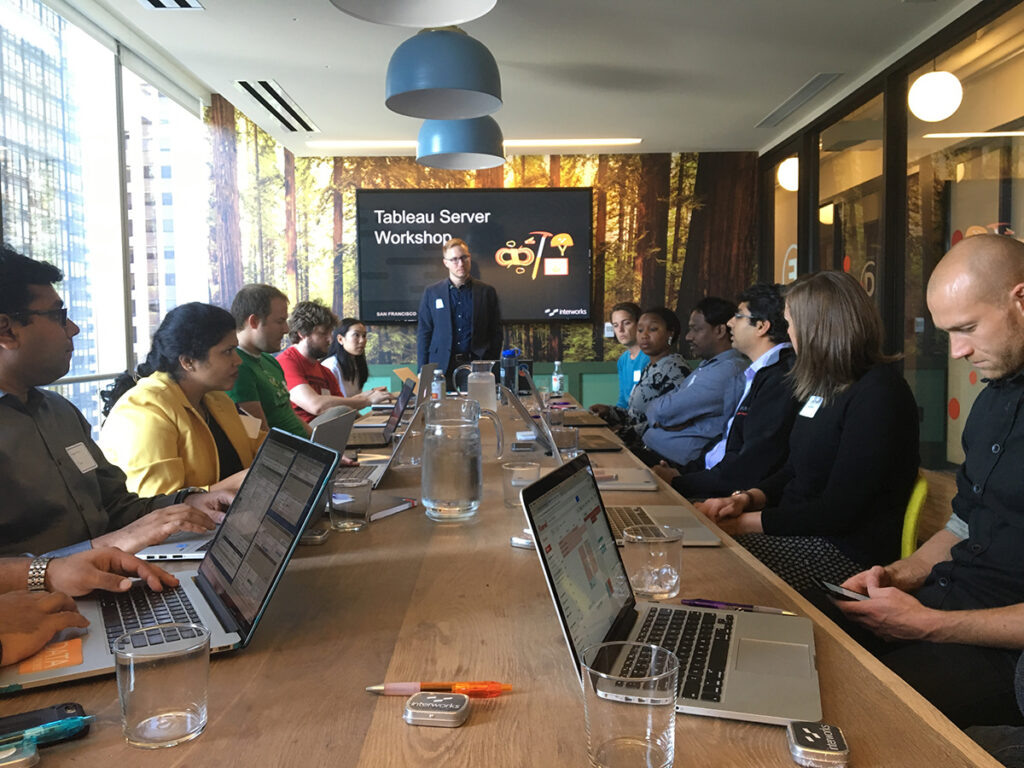
Tableau purchased Power Tools in 2019. Contact Us for more information. I had the opportunity to join InterWorks at the beginning of 2014 and play a key role in the launch of a brand new toolset called Power Tools for Tableau. At that point in time, there were not many third-party tools integrating with Tableau. […]
My Current Writing System

I’m constantly tweaking my writing systems to improve the efficiency and quality of my output for whatever writing task I have. I divide my writing by environment (Windows, iOS and MacOS), device and purpose (social media, email, blog posts and book creation). I use different apps for different workloads. These are my current tools of […]
InterWorks Blog Roundup – December 2016

With the onslaught of holidays, December is always a relatively slow month for the InterWorks blog. That’s not to say we didn’t have some excellent and varied blog posts. See how we finished out 2016 below: Tableau Training Questions from Tableau Training: Labeling the Top N Tableau Vizzes Tableau Your Turkey! – Turkey Hunting in Oklahoma […]
Hardware and Clothing Tech I Liked in 2016

Above: Lake Tahoe was perfect this holiday season. I’ve been on vacation longer over the holidays than any time since I backpacked in Alaska 25 years ago. It began by spending five days skiing in Lake Tahoe with the family. The remaining time I spent at home reflecting on last year and thinking about the new year. Ignoring […]
Exploring Medicare Part D Data in Tableau
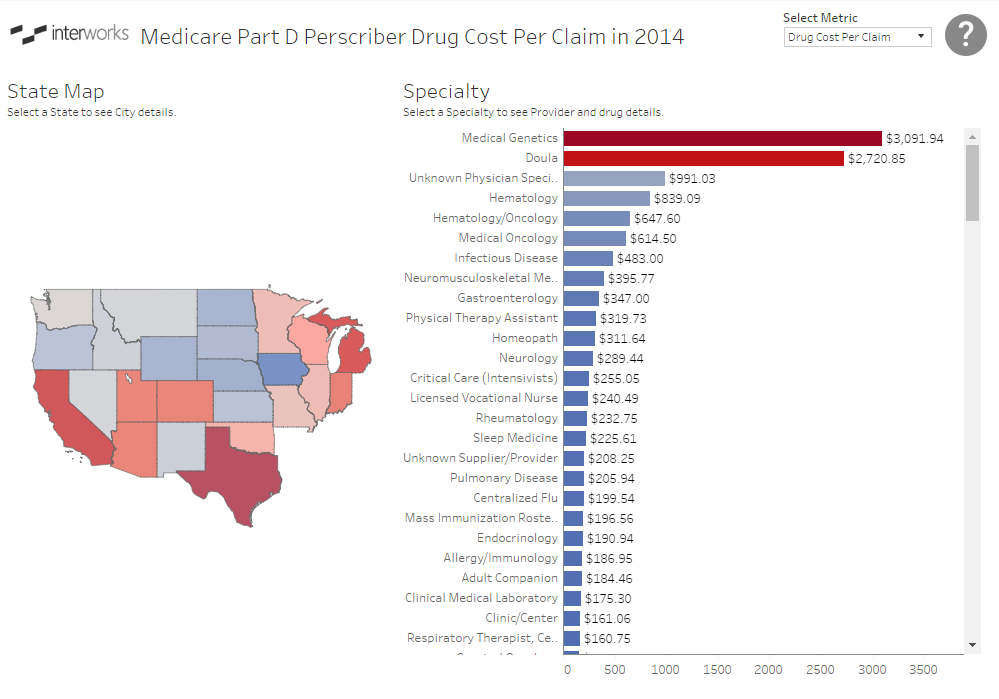
The idea behind these reports is to allow the user to explore Medicare Part D Prescription claims across the country. In 2014, Medicare Part D had 40.5 million beneficiaries. That’s roughly 12 out of every 100 Americans, which equates to a lot of data. In order to use a data set under the Tableau public limit of […]
PYD23 – Randy Krum – Author and Infographic King

Randy Krum, author of “Cool Infographics” and coolinfographics.com, joins Tim to talk about his experience in the data industry, his and Tim’s favorite hats and getting involved in the community. Get a free chapter of his book at http://www.coolinfographics.com/book.
How I Went from Government to InterWorks’ Weird Company Culture

I grew up in Midwest City, Oklahoma. I was a military kid and got involved with computers and video games at a young age. I was grounded at 9 for swapping out my first modem while my dad was TDY. It was worth it and all its 14.4 kbps glory. I started building and repairing […]