Questions from Tableau Training: Labeling the Top N
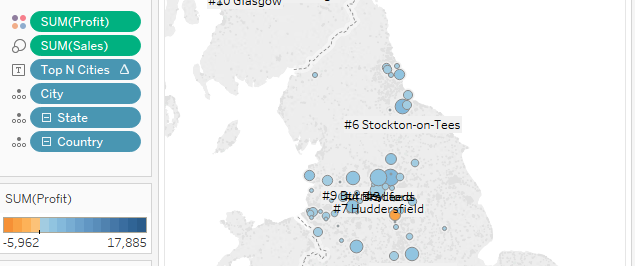
Here’s a question I got from a student named Summer in a DII: Intermediate course in Hong Kong: “I want to show all of the cities in the United Kingdom for a particular measure but only show city name labels for the top five.” Awesome question! Let’s get to solving. We’ll use the Global Superstore […]
Impressions from the Third Annual InterWorks BI Summit
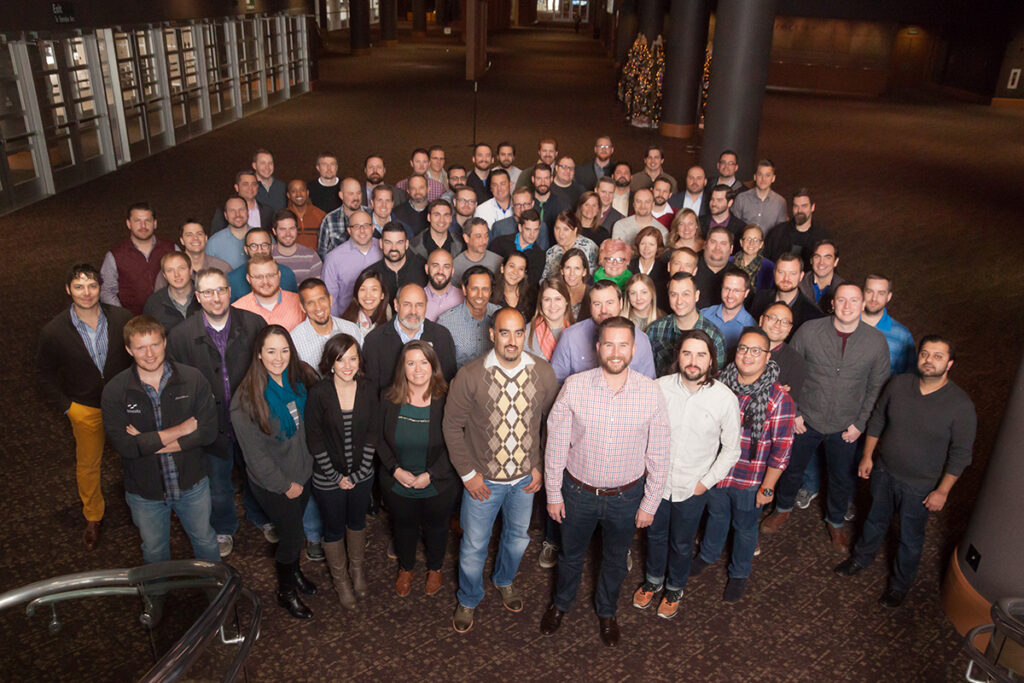
Tableau purchased Power Tools in 2019. Contact Us for more information. As a global consulting firm, it’s well understood that InterWorks employs a large number of consultants who are scattered to the winds. Whether it’s in the Bay Area, New York, Chicago or even across the pond in Europe, our reach is broad and only […]
PYD22 – Francois Ajenstat – Tableau Chief Product Officer

Have you heard of Francois Ajenstat? He’s only the Chief Product Officer at Tableau. He stopped by to talk with Zen Master Robert about #data16, his history at Microsoft, his new role, how to fill buckets, where you can find his name in all kinds of databases and much more. It’s his job to talk and […]
Adobe MAX Through the Eyes of an InterWorks Analytics Consultant

I started at InterWorks back in olde July 2012 (I used to open casinos), which in Tableau and InterWorks years makes me one of the oldest people alive. Since San Diego in 2012, I’ve been attending the annual Tableau Conference with the InterWorks team. The scale of the last couple shows (15,000+ in Austin) is comical […]
InterWorks Blog Roundup – November 2016

There’s much to be thankful for in November, namely some new content! We wrapped up another epic Tableau Conference and had plenty of coverage on the blog. Additionally, we saw an interesting mix of deep dives, videos and an excellent podcast. Between the conference and Thanksgiving, we weren’t as prolific as usual, but we certainly didn’t skimp […]
PYD21 – Iron Viz
2016 Iron Viz contestants Russell Spangler, Robert Rouse and winner Curtis Harris recount their experiences at TC16. How does one prepare for those 20 minutes where it’s just you and the data? How do the feeder competitions compare? What was their favorite moments AFTER the competition? Who of the three knows where you can get the best pulled […]
Tableau Your Turkey! – Turkey Hunting in Oklahoma
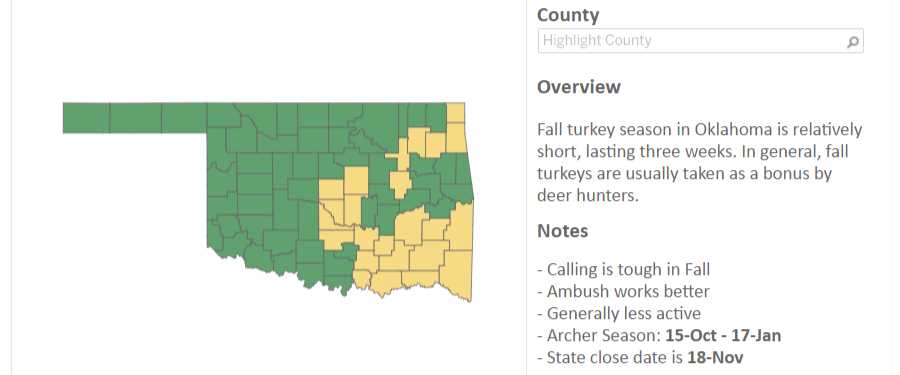
Ah, the weeks after Thanksgiving. Nothing but cold turkey sandwiches and residual guilt from eating so much. Even though this post comes at a time when we’re all exceedingly tired of this tasty fowl, I couldn’t get an idea for a viz out of my head: Why not visualize when and where you can hunt turkey in […]
Purging Duplicate Calendar Entries from Office 365 via PowerShell
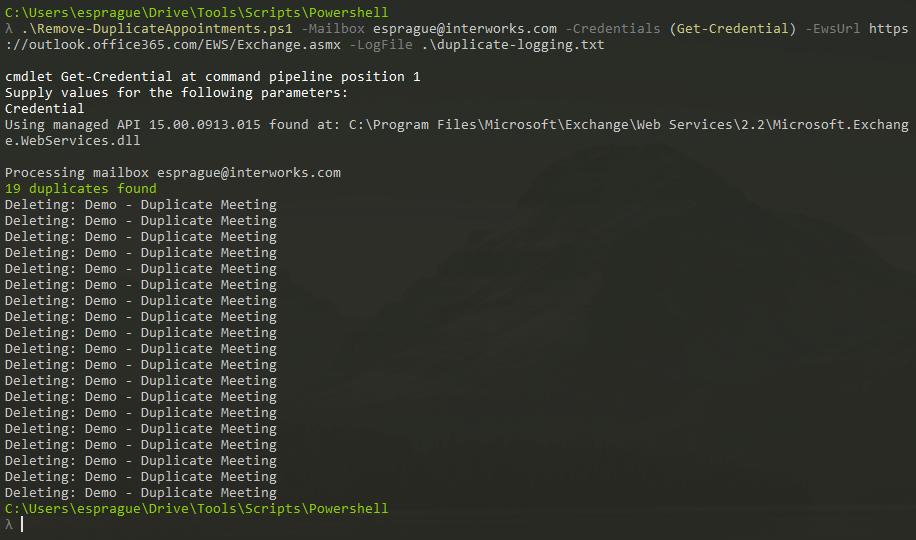
Many of us heavily rely on our digital calendars to organize our schedules, and with those often come third-party conferencing products such as Webex, GoToMeeting and a myriad of others services to help accommodate these needs. However, we recently came across an issue where one of these tools crashed while sending a calendar invite causing over 30,000 […]
Tableau Deep Dive: Sets – Hierarchies
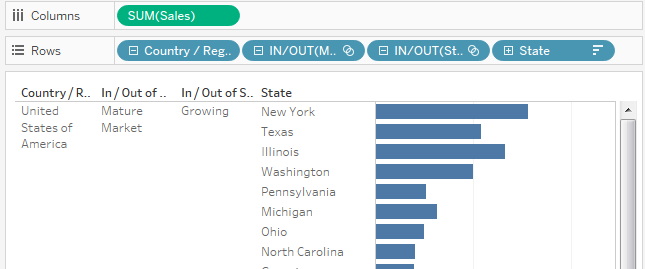
In last article in our Deep Dive on Sets, we will explore how we can use sets inside of a hierarchy. It adds dynamism to your hierarchies, particularly if you nest multiple computed sets into a single hierarchy. Let’s learn how to do it! Hierarchy Overview A hierarchy allows us organize different dimensions into a […]
Exasol vs. Tableau Extracts – A Case Study from Iron Viz
You have 20 minutes to build a dashboard from scratch with 1.3 billion rows of New York City taxi data. What do you do? Can your database handle the task? Are Tableau extracts the answer? In this webinar, Iron Viz contestant and Tableau Zen Master Robert Rouse discusses how he solved this problem. He describes the challenges […]