Unexpected Surprises: IMDB Movie Analytics
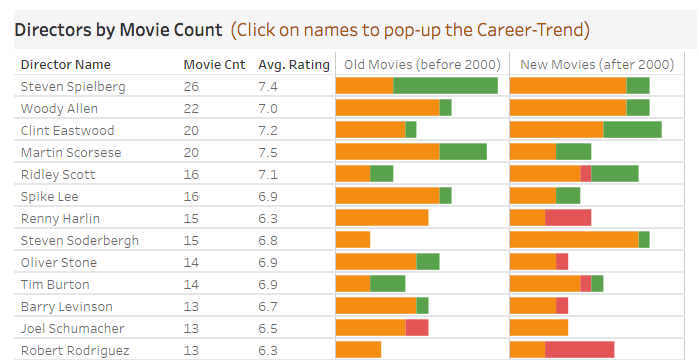
I haven’t blogged much recently, but I wanted to quickly share a really great moment. Onsite with one of our long-term and larger NYC clients, I recently had the pleasure of “judging” an internal Iron Viz competition. This competition was part of a day-long Tableau and analytics focused event lineup that included amazing internal hosts, […]
PYD33 – Steve Wexler and Jeffrey Shaffer – The Big Book of Dashboards

Authors Steve Wexler and Jeffrey Shaffer chat with our own David Pires about their new book The Big Book of Dashboards. Get the inside story on the process of gathering, curating, and legal-wrangling of this HUGE book of some of the most interesting vizzes out there now. Check out the companion site, http://bigbookofdashboards.com/ and get the book […]
EXASOL – Small Business Edition
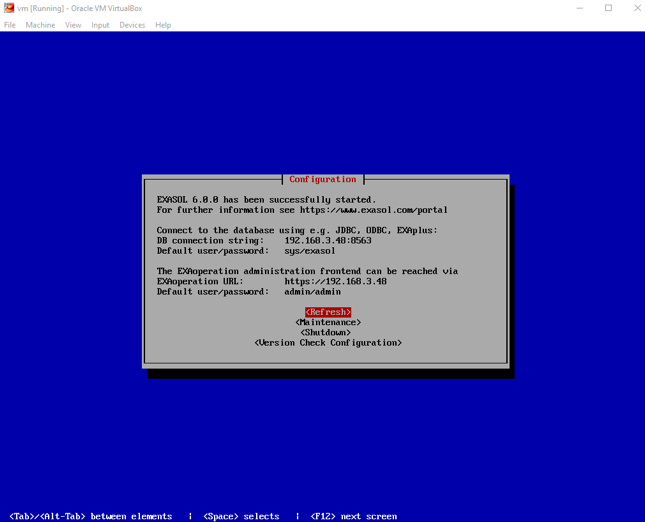
Many of you must have heard about EXASOL. If not, I hope this blog gives you the motivation to discover it’s capabilities for yourself. Before purchasing one, I encourage you to try the free EXASOL small business edition. A free version!? Yes, the EXASOL small business edition is a free-to-use, one-node instance of EXASOL in-memory […]
Tableau Deep Dive: Dashboard Design – Adding Interactivity
In the first three articles of this Deep Dive on Dashboard Design, we’ve constructed our proof of concept. All of the worksheets have been planned, built and laid out in the structure best suited for our dashboard objective. Now we’re going to talk about how we can make our dashboard interactive. Remember, this is Tableau, […]
Webcast Friday: Tableau Server Performance Monitoring
On the second ever Webcast Friday that InterWorks has produced, I had the honor of speaking to our web audience about Tableau Server performance monitoring. In this talk, I wanted to highlight what a server does for us, what makes a server run slowly, what aspects make up a Tableau Server and how to optimize […]
Maximise Your TCOT Experience!
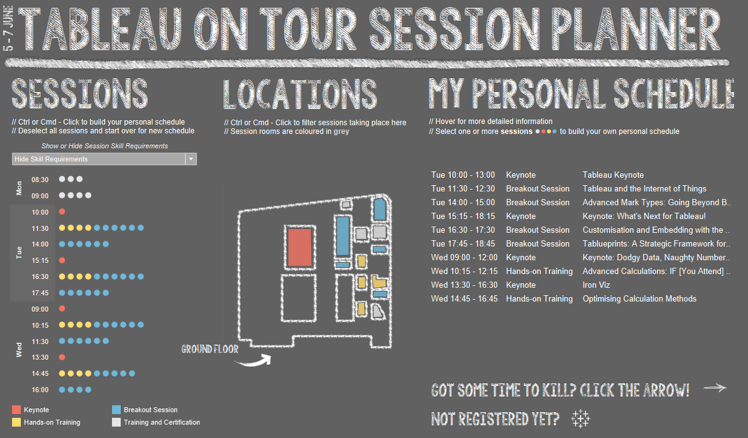
With Tableau Conference on Tour coming to London in little over a month, I’ve been thinking about how to spend my time. This got me thinking about how I maximise my professional development experience…which led me to want to create an updated version of this pretty cool planner on Tableau Public, originally created by team member Fabian Zimmer. […]
Milwaukee TUG: What Went Down
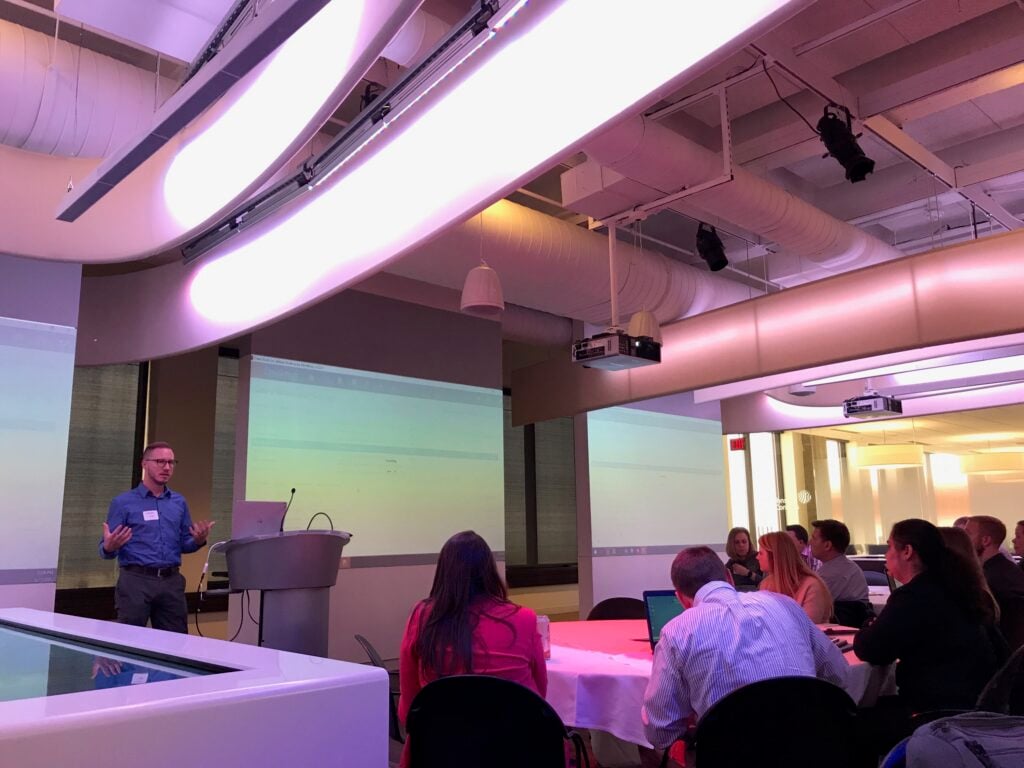
Last week, InterWorks played a key role in the Milwaukee Tableau User Group (TUG) event. Their mission was to gain information regarding our customers primary Tableau needs and showcase our Power Tools for Tableau. Representing InterWorks in Milwaukee was Zion Spencer, Matt Albacete and Rick Thomas. Matt and Rick are Chicago based and closely connected […]
Tableau Deep Dive: Dashboard Design – Proof of Concept

We are now ready to start building a proof of concept or POC of our dashboard. Think of a POC as a prototype or your Beta test. We are focused on dashboard design, so I won’t spend much time on the actual construction of individual worksheets. Instead, let’s focus on bringing them together into a […]
TCOT 2017 – Bigger and Better!
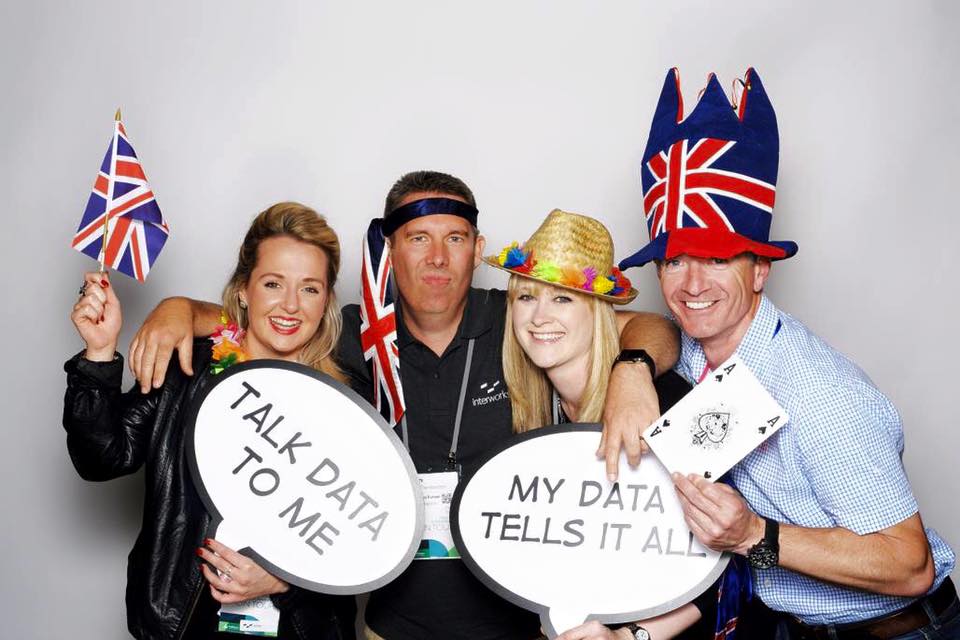
It’s that time of year again, but this year InterWorks is going bigger and bolder! We cannot wait to hit Tableau Conference on Tour London and Berlin 2017 (TCOT to you veterans), and hope to see a lot of old and new faces there. As a GOLD sponsor, not only will we have our own booth, but we will be sponsoring the Social Media Hub! Stop […]
Skyline Analytics in EXASOL
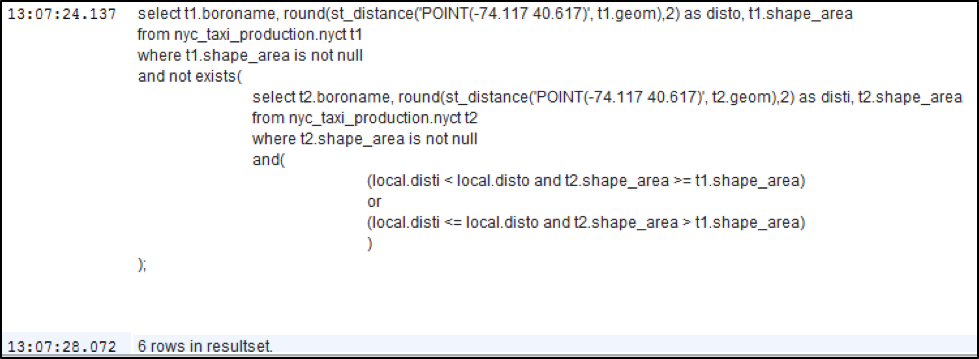
Skyline is used for attacking problems involving choice. Where there is more than one criterion, no computer can possibly choose the “best” solution. Skyline function helps in assisting decision making that involves more than one good choice. It gives you a shortlist of “good” dataset choices from a high performance database for further analysis. What […]
