PYD40 – Hadley Wickham – Chief Scientist
On this week’s episode, InterWorks Analytics Consultant and Alteryx Ace, Michael Treadwell sits down with Hadley Wickham. As an author, contributor and Chief Scientist at R Studio, Hadley is on the forefront of building better tools for data science. Even if you don’t have a background in coding, he’s all about getting people up to […]
Visualising German Football with Tableau and Google Sheets
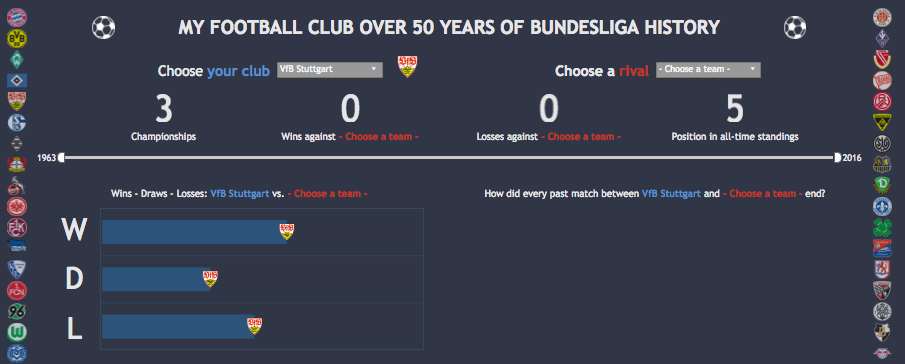
Have you ever come across a problem where you would like to visualise the data to understand it better? If the data resides in a table on a website, how would you solve it? Typically, people try to export the table or copy it into Excel and then connect Tableau to it. However, there is […]
Questions from Tableau Training: Using Cross Joins to Solve Active Tickets

This is one of the many questions I get asked as a Tableau Trainer. It may seem straight forward enough, but it isn’t! “Is there a way to work out how many active customers we have at any given time?” Prepping the Data Most clients have data that is time series based. They know when […]
Combine Your Projects with Workbook Merge
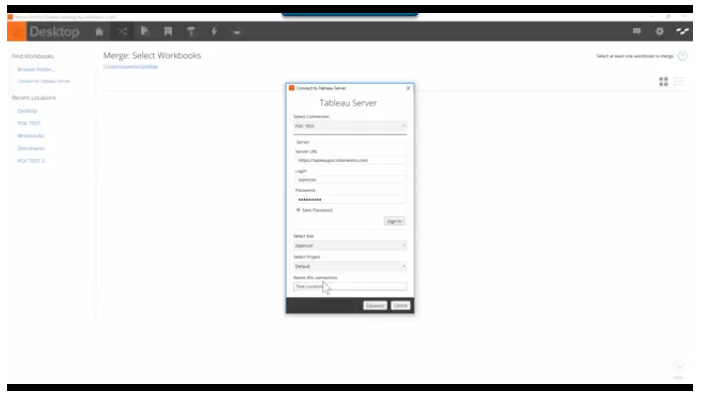
Tableau purchased Power Tools in 2019. Contact Us for more information. Zion Spencer is back at it with another Power Tools for Tableau demo video! Our dive into Power Tools: Desktop wraps up with a look at the Workbook Merge tool. You can see the other demos on Best Practice Analyzer, Data Source Audit, Power Tools: […]
2017 Tableau Fantasy Football Draft Kit
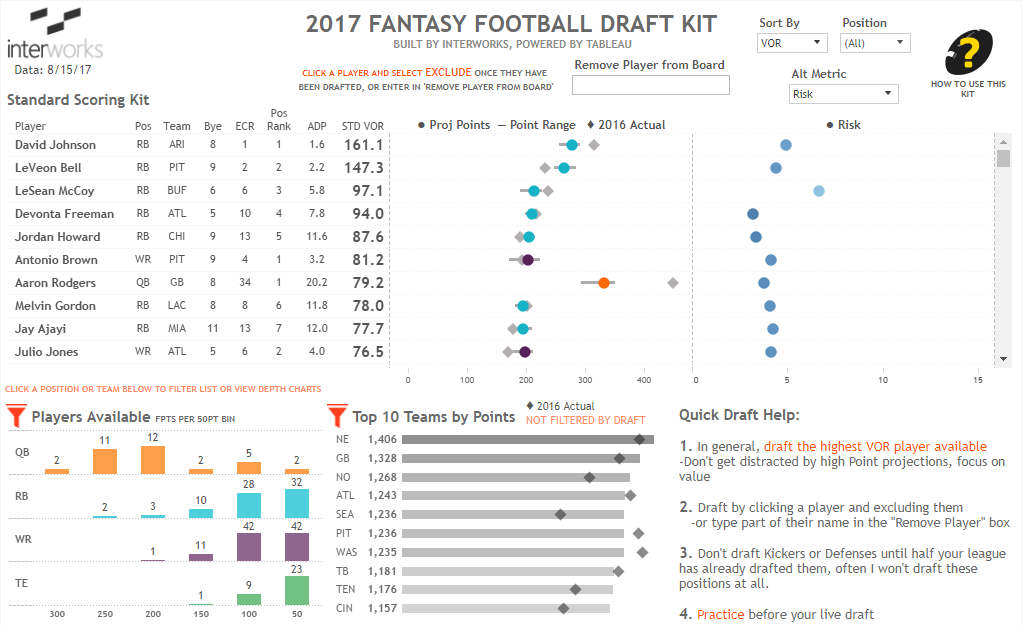
Jump to the draft kit. We’re well into August, which means American Football is back. The offseason is always excruciating, and no amount of baseball or US soccer can fill the void that football leaves. Though the regular season starts in a few weeks, the hype and preparation has already begun – specifically surrounding fantasy […]
Data + Insight + You: A Recap
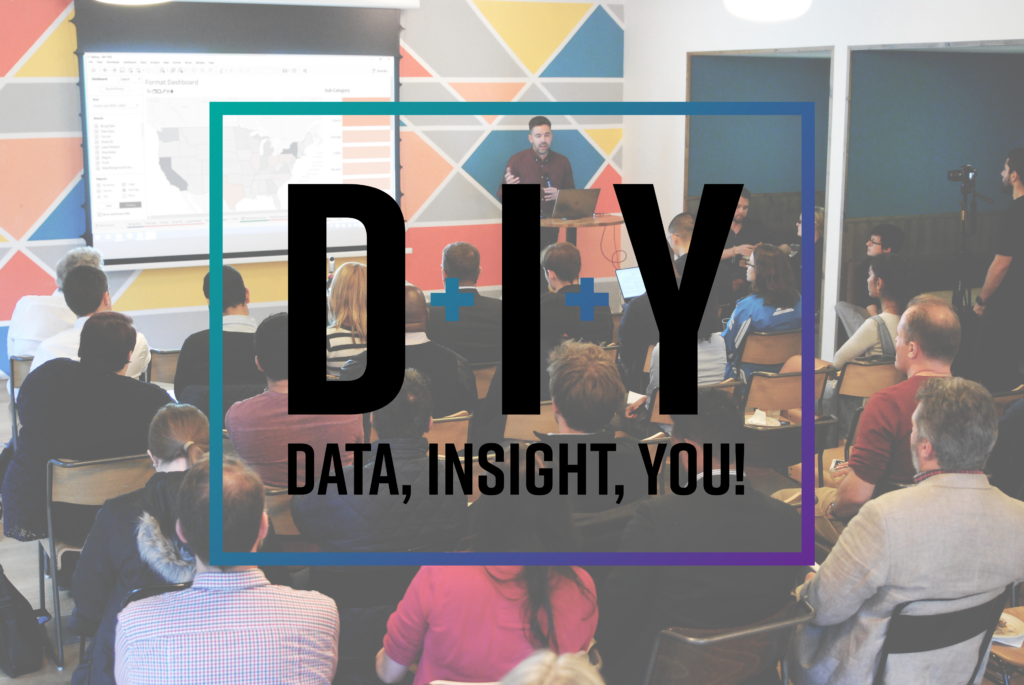
What is DIY? Data, Insight, You is InterWorks’ newest event series for people in the data community to meet and discuss analytics. We bring in speakers from the community, vendors and our own consultants to share their analytics experiences, both the good and bad! Each event focuses on a different aspect of what helps people deliver amazing analytics. […]
PYD39 – Eva Murray – EXASOL Tableau Evangelist
Today’s episode reaches across the pond as David Pires from our EU team sits down with EXASOL’s Head of BI and Tableau Evangelist, Eva Murray. Four years ago, while working for one of the largest banks in Australia, she became introduced to Tableau. Fast forward to today, she’s living in Germany and working for one […]
Five Tips on How to Become a Lifelong Learner

I love to explore new technologies that expand my way of thinking. In order to build new skills, I find myself on a constant search for improvement. Below, I’ve shared five easy steps that have helped me on my lifelong learning journey. Hopefully they will help you too! #1: Find Your Mentor Whether this includes friends, […]
InterWorks Blog Roundup – July 2017

Now that July has come and gone, summer is nearly over. With four vizzes this month designed by our amazing analysts and a particularly relevant blog by David Duncan on design, July was clearly the month of dashboard design. With the countdown to the Tableau Conference beginning, people are more focused than ever on best […]
PYD38 – Data Training Roundtable

We have a very special show this week. Listen in as Sian Davies from InterWorks Europe discusses our Tableau training services with Carly Capitula, IW Head of Training and Enablement Practice, James Austin, IW EU Consultant, and Sarah Nell, Product Manager of E-learning and Certification at Tableau. Find out what it takes to develop a dynamic […]
