Automatically Sync Your Dashboards with Portals for Tableau
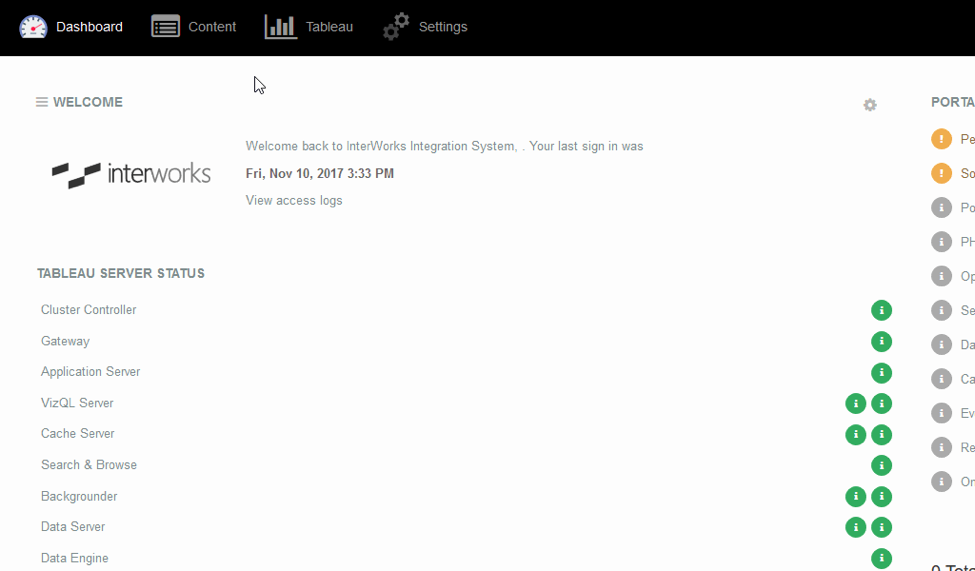
If you use InterWorks’ version of embedded analytics, Portals for Tableau, you already know how quick and easy it is to display a dashboard in it. If you aren’t lucky enough to have experienced creating a dashboard in a portal, it’s easier than cracking the screen on your phone and faster than the regret that will […]
PYD46 – Debbie Forster – Creating a Culture of Innovation

This week, we have a special episode of Podcast Your Data! from across the pond! InterWorks U.K.’s Sian Davies hosts Tech Talent Charter CEO Debbie Forster. As a member of the British Empire and one of the “20 Most Influential Women in U.K. IT” since 2014, Debbie is a leading figure in the U.K.’s tech […]
A Data Science Treatise: Part Two – Success Through Tinkering
In part one of this series, I laid out a pretty grim reality for many organizations seeking to gain insight from data science. For this post, I will spend more time talking about the exciting possibilities that can be accomplished with data science rather than the pitfalls. Why Data Science? People who no longer want […]
From A to Z: The Healthy Data Ecosystem Alphabet
Every once in a while, I wake up in the middle of the night and don’t feel like reading a book. This happened a few weeks ago and I started thinking about business information and the alphabet. I decided to try to come up with a sentence that described some aspect of a healthy data ecosystem […]
How to Create Bins on a Histogram in Tableau
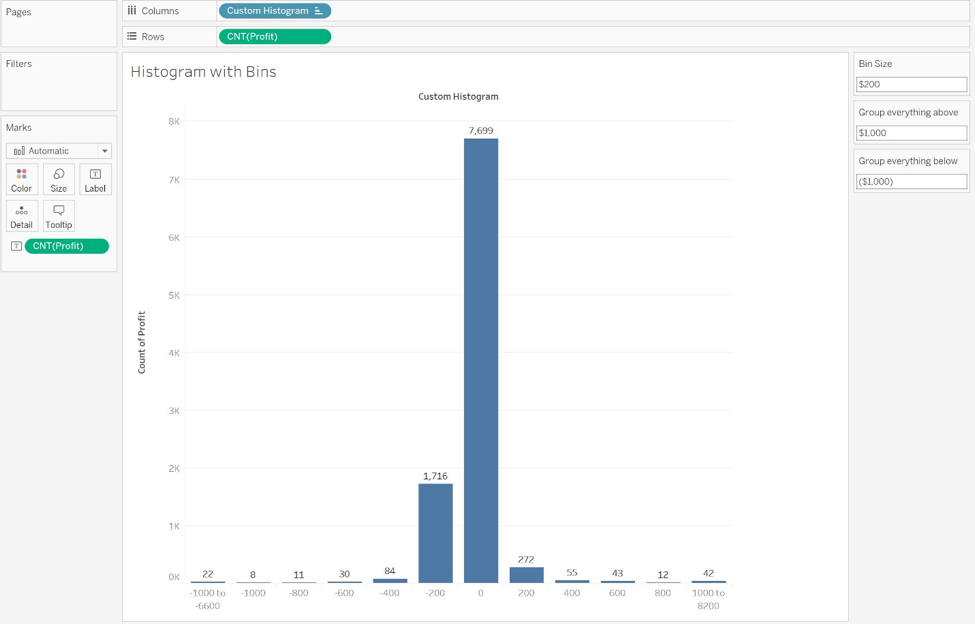
(Note: This post is an expanded version of an article I originally posted on the Tableau Community Forums prior to joining InterWorks.) Tableau has the awesome capability to build bins and instantly create histograms, but it comes with a couple limitations. First, bins are not available for use in calculations. It turns out, Tableau has a […]
Tableau for Finance: How to Save Your Time

What is the most valuable commodity for your finance team? You might say people. Well, let’s assume you have the right people, with the right skills, in the right jobs. After that, what would be your answer? My answer would be time. Time is a scarce resource in my world and I’m sure many finance teams have […]
A Glimpse into InterWorks’ Onboarding Experience

If you never get a second chance to make a first impression, then a company’s onboarding process is a great opportunity (and risk). By creating an inviting, exciting and unforgettable experience for our new hires, we get the chance to permanently imprint our values and culture. If it goes wrong … well, then we’ve started a new hire […]
My Machine Learning Journey: The First Weeks
Welcome back! Today we’re going to trace my steps through the first few weeks of the Machine Learning Nanodegree program. If you missed the first post, check it out! So far, I’m feeling good about my experience and I’m excited to share what I’ve learned so far. This will likely end up being the longest post […]
The Quantified Car: Part One – Speed and Cost
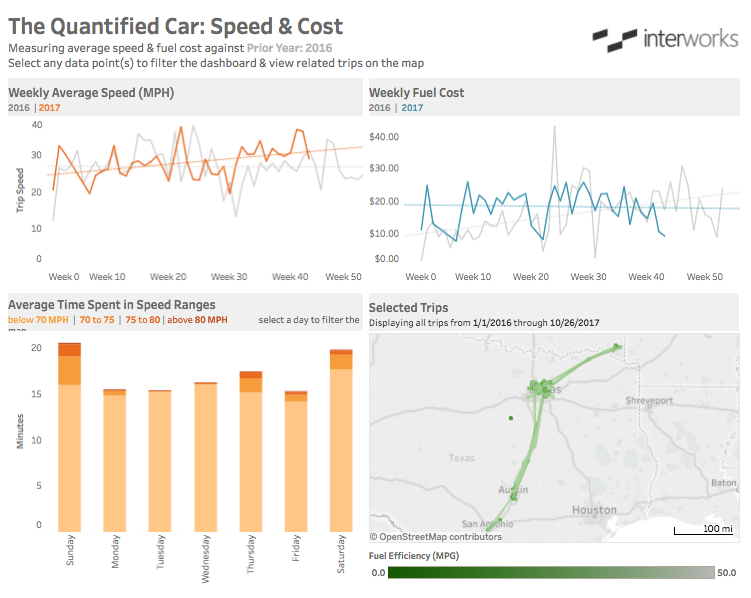
Like most people here at InterWorks, I really love data. I’ve been collecting data about different aspects of my life for a long time. Several years ago, I discovered Automatic – a little device that plugs into your car’s on-board diagnostics port and logs data about your driving. I’ve logged nearly every trip for over two […]
Event Debrief – October 2017

October reigned supreme with the busiest event of our year: the 2017 Tableau Conference. If you missed the conference, we have many blogs devoted to TC17. Whether you want a keynote analysis or a social media summary, chances are it is on our blog. But let’s step away from TC17 for a moment. Our October event […]
