InterWorks Blog Roundup – October 2017

Has everyone recovered from the 2017 Tableau Conference? We sure haven’t! From the keynotes, Data Night Out and all the informative sessions, we are still riding high from Vegas. There were so many exciting announcements to come out of TC17, it’s hard to narrow down which we’re most excited for! Luckily, our amazing consultants have […]
Hot-Swapping Dimensions with LOD Expressions in Tableau
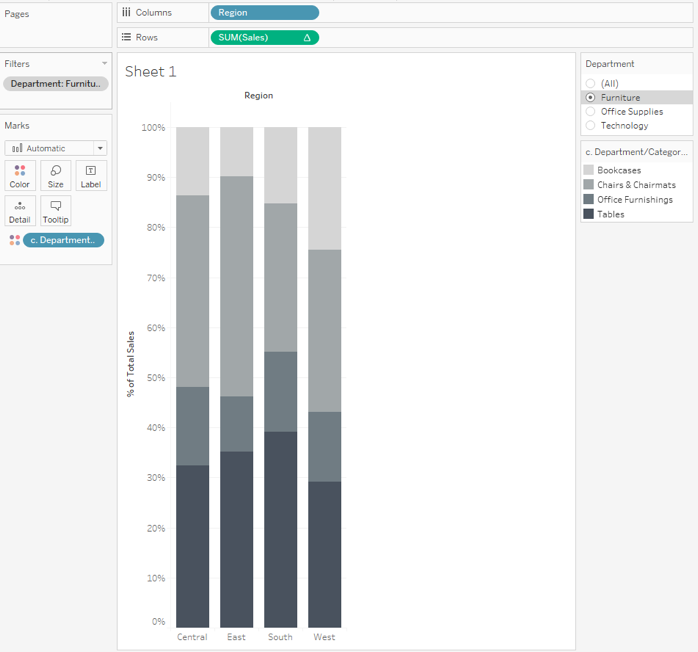
During a recent project, I received an interesting question: “Can we swap what dimension is displayed in a stacked bar chart based on a filter being applied?” I’ve decided it would be easier for me to answer this question by showing you how to do it with the Superstore data. Below, we have a stacked bar […]
Building a Washington, D.C. Museum Crawl with Tableau
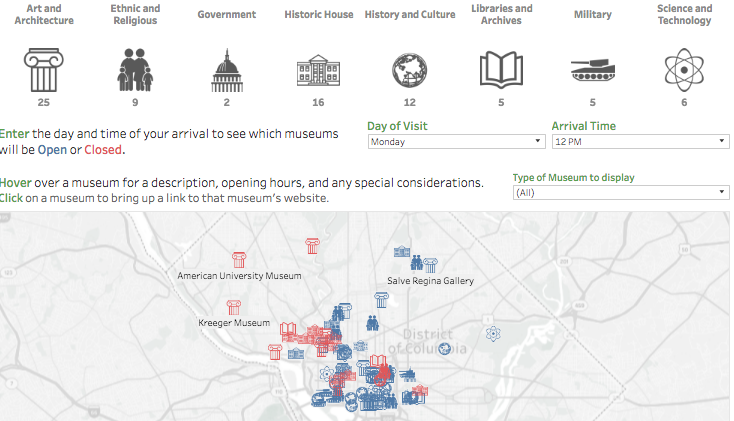
Washington, D.C. is packed with incredible places to visit. As someone who didn’t grow up near the U.S. capital, I am constantly amazed during each visit by the access to museums, culture and history I could only read about while growing up in Colorado. The trouble with having so many amazing sights to visit is trying to […]
PYD45 – Oliver Wise – Analytics and Local Government

Today, we’ve got a special political edition of Podcast Your Data! InterWorks’ Michael Treadwell discusses data analytics in local government with Oliver Wise. As the Director of Performance and Accountability in New Orleans, Oliver is all about using data in a positive way to impact cities. In fact, he launched the very first performance management […]
A Data Science Treatise: Part One – Failure
One of my least favorite phrases currently being used in the analytics world is “data science.” This is ironic since “data science” is in my official InterWorks job title. But every time I hear the phrase, I get a little knot in my stomach similar to the one I feel on a turbulent plane. Five years […]
Tableau Extended: The Product Line
InterWorks has created several blog series targeting Tableau users, including the “Tableau Essentials” series, the “Tableau Performance Checklist” and my own “Tableau Deep Dives.” These articles are among the most popular on our blog and our readers are always asking for more content on how to better use Tableau Software. So, it’s time to introduce […]
How to Build Company-Wide Connectivity with Tableau
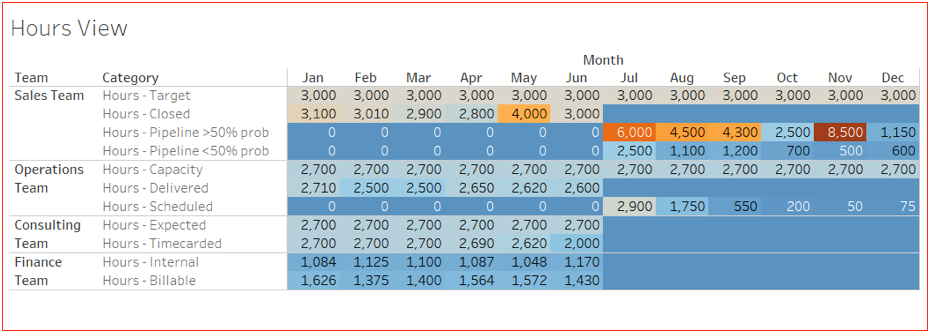
Tableau isn’t just a useful tool for visualising and analysing data. There’s no doubt it has enabled me to improve and optimise my team, but there’s another benefit I did not initially appreciate when I first began using Tableau. Coming from the world of Excel, my approach was often to use my experience in that […]
Tableau Viz: How Much Heat Can You Handle?
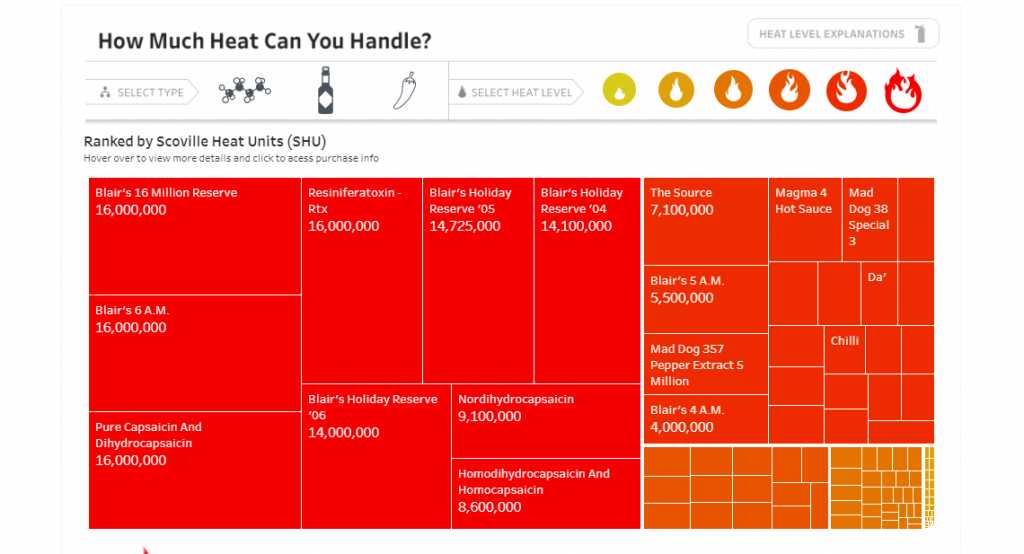
It might sound controversial, but a common practice in my family (and many families throughout Louisiana) was something called “hotsaucing.” What exactly is that? When your a kid acts up, you punish them by making them eat a little bit of hot sauce. The jury is still out on whether it taught me discipline, but it […]
Fun with Window Functions in Tableau
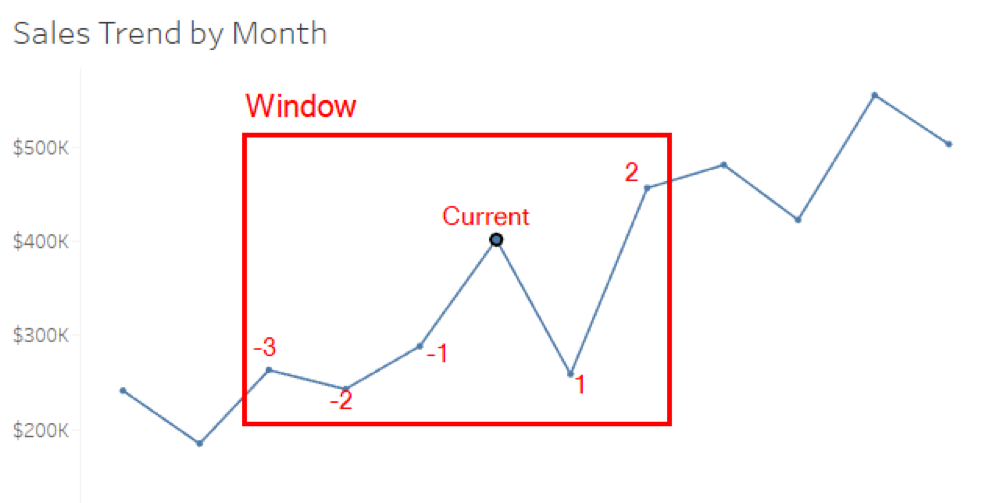
Table calculations are one of the hardest functions to understand in Tableau Desktop. A lot of us are guilty of clicking through every single option on the table calculation window until we find something that looks right. There is a lot of great material out there to help polish up your table calculations, so I’ll […]
My Machine Learning Journey: Introduction

I finally cracked and decided to shove everything in my personal life aside for the next few months to take on Udacity’s Machine Learning Nanodegree Program. Goodbye video games and ice-cold beer! On second thought, beer, you should stay. I might require a cheerleader. Jokes aside, I’ve had my eyes on this program for quite some time. After […]
