InterWorks Named 2017 Tableau Reseller of the Year

InterWorks was just honored as the 2017 Tableau Reseller of the Year for the Americas! The announcement came as part of Tableau’s Partner Executive Kickoff – an annual gathering of partners from around the globe. “We’re honored to receive this award. This says a lot about the hard work our people have put in to […]
PYD50 – Irwin Dolobowsky & Tableau Server on Linux

PYD has reached its fiftieth episode! To celebrate, we’re talking with Tableau Senior Product Manager Irwin Dolobowsky to discover how he and his team brought Tableau Server to the Linux platform. InterWorks Solutions Architect Tony Kau asks the tough (and some not-so-tough) questions about Tableau Server on Linux, but Irwin is definitely the guy for the […]
Questions from Training: Comparing Metrics for Same Weekday in Previous Year
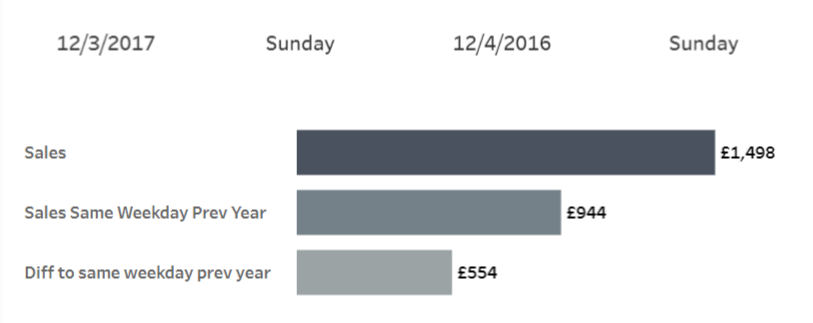
This is a question that came up in a class I taught to a commercial airline who were looking at their web analytics data, I also taught it in a colleague’s class dealing with car parking at airports: “How can I compare a metric against the same weekday in a previous year?” Do you want to […]
VMware 5.5 Support Is Ending Soon, Upgrade to 6.5 Today

The general support timeframe for VMware vSphere 5.5, including both ESXi and vCenter, ends later this year – specifically, September 19. That might not seem close, but a few months can burn by quickly in the IT world. While there are some options for extended support at a very premium price, we strongly urge anyone […]
My Machine Learning Journey: The Second Project

Welcome back! The holiday season flew by, and if people were feeling generous, then it’s likely many non-profit organizations were showered in charitable donations. What does that have to do with machine learning? Let’s find out as we explore the second project in Udacity’s machine learning nanodegree. Can We Predict How Customers Will Act? This project places […]
Questions from Tableau Training: Moving Reference Line Labels
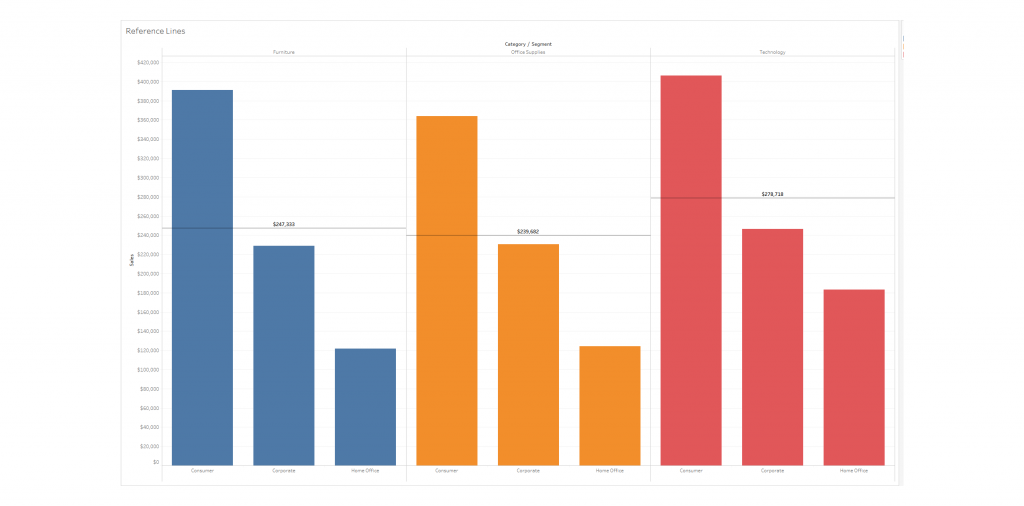
This question came from Jerry in a New York City Desktop I class: “How can I change this view so my reference line labels are easier to read?” Great question! I agree – they are kind of tricky to read on the left-hand side of our groups of bars. By default, our reference line labels […]
The 2017 InterWorks Event Debrief
2018 is full-steam ahead! Before we tell you about the exciting events we are gearing up for this year, let’s reflect on how InterWorks made our events better each step of the way. Looking back, we saw a dramatic increase in the number and types of events we did, but that’s not the goal. As Global Marketing Manager Jenny Parnell put it, “Our […]
Friends Don’t Let Friends Make Pie Charts
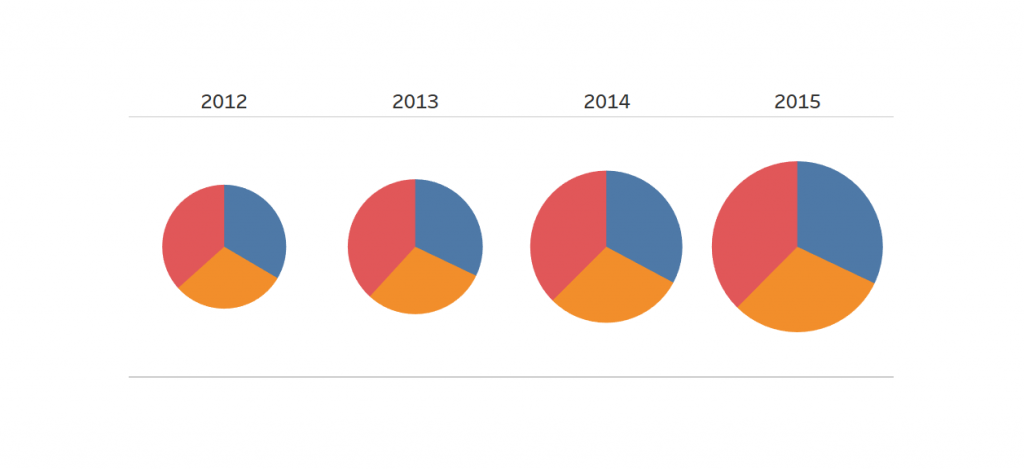
It’s a common trope in the data analytics community to tsk tsk at any mention or appearance of the poor pie chart. There’s no other chart type that collects such derision and disdain. But why? Let’s tackle the pie chart and explain how it is one of the most overused and misused visualizations. And then […]
PYD49 – Tableau 10.5 Updates

It’s the first Podcast Your Data! episode of the new year, and there is already plenty to discuss. We have a full cast of characters as Robert Rouse, Tony Kau and Brad Fair team up for a roundtable discussion on everything you need to know about Tableau 10.5. They explain all the changes and new […]
Tableau Server on Linux Is Here. Should You Make the Switch?

There’s significant merit to the phrase, “If it ain’t broke, don’t fix it.” If you’re currently running Tableau Server in your organization on Windows, but considering making the switch to Linux, please use this blog post to help you arrive at an informed decision. We’ll discuss the caveats and weigh the pros and cons below […]
