Tableau Prep: How to Cleanse Your Data and Prepare It for World Domination Analysis
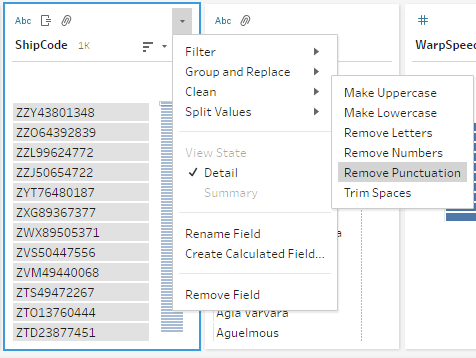
Hello again, data friends. My focus for this blog post will be the variety of formidable data cleansing options available in Tableau Prep (TP for short). I long for the day when data arrives clean – no bogus characters, mismatched naming conventions and or even duplicates. While I’m dreaming, I’d also love to have a […]
How to Properly Render Custom Fonts in Tableau
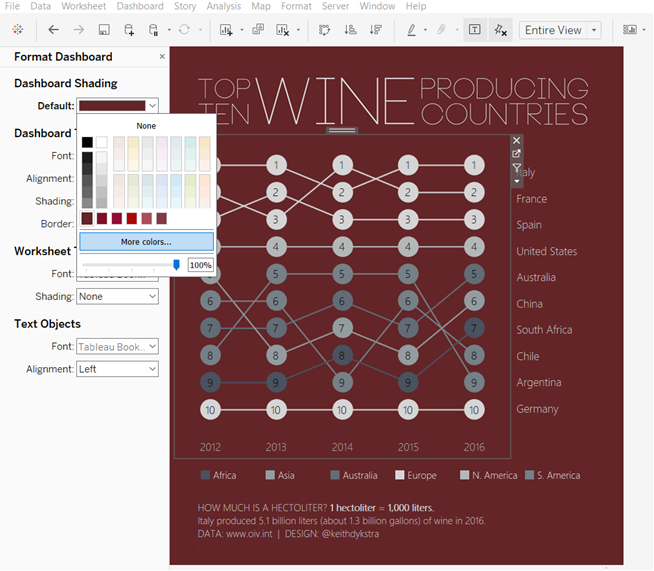
Times New Roman? How did that happen? That’s not the font I used! As I walked around the room, I noticed that several of my colleagues were seeing my dashboard with an entirely different font than the one I had chosen. It was one of the first major dashboards I had developed, and I had […]
Portals for Tableau New Feature Spotlight: Report Builder Cover and Footer Pages
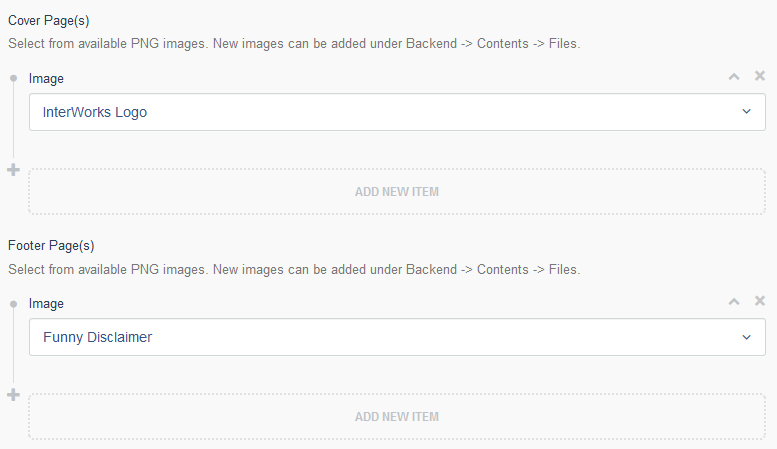
When you’ve had a taste of Portals for Tableau’s report builder functionality, you invariably want more. It started as simply taking snapshots of several dashboards and exporting them as a Microsoft PowerPoint presentation. Then, it was exporting those same snapshots as a PDF file. Next, there was the ability to set a PowerPoint template, control […]
Combining Data with Joins
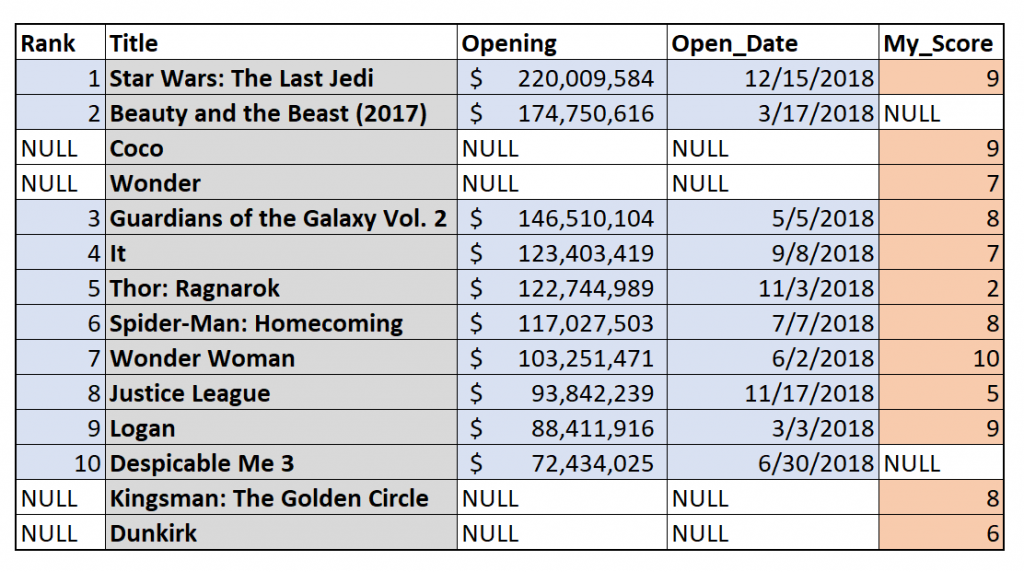
I rarely ever receive pristine data, and I’d wager that’s true for most of us working in data analysis or business intelligence. Data can come to us from dozens—if not hundreds—of sources, and it certainly requires some preparation to make it useful. One of the most common data preparation tasks is to combine columns from […]
Superior IT Service in a Service-Weary World
I slammed the phone down a bit harder than the last time. I felt my face redden, the tendons in my neck tense and small beads of sweat erupt from just below my hairline. For the third time today, I had been tossed from human to human after listening closely because the menu items had […]
Portals for Tableau New Feature Spotlight: API Relay
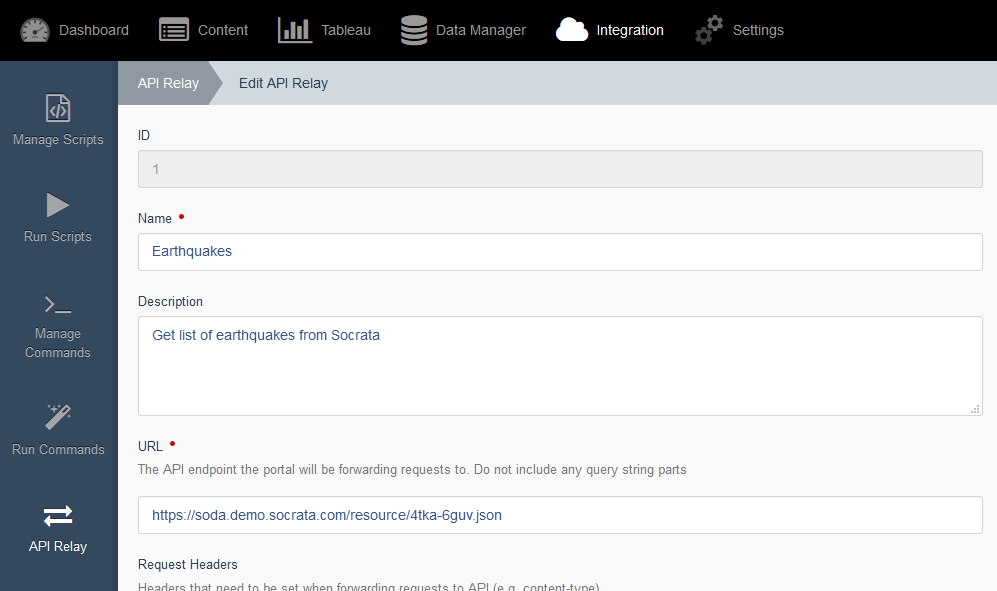
You’ve got a Portal for Tableau. You’ve got Dataiku. You’ve also got an ingenious idea to use some of the data science from your awesome new Dataiku project on your portal’s frontend. For instance, you want to provide an interactive form to predict the weather at a user’s location, or maybe something actually useful […]
Tableau Prep: First Impressions from a Data Engineer
Guys and gals, I’m excited – my favorite data visualization tool, Tableau, now has a data preparation and transformation tool. It’s called Tableau Prep (Project Maestro when in beta) and yes, it is awesome. Tableau Prep is a personal data preparation tool that empowers the user with the ability to cleanse, aggregate, merge or otherwise […]
PYD56 – Tableau Prep With Isaac Kunen And Arthur Gyldenege

Tableau Prep (formerly known as Maestro) came out with the Tableau 2018.1 release and we got to talk to a couple of the men who helped shape it! Analytics Consultant Mat Hughes sat down with Isaac Kunen and Arther Gyldenege about their journey in creating Tableau Prep, the importance of listening to users’ feedback and […]
Visualising Tea Production and Consumption Around the Globe
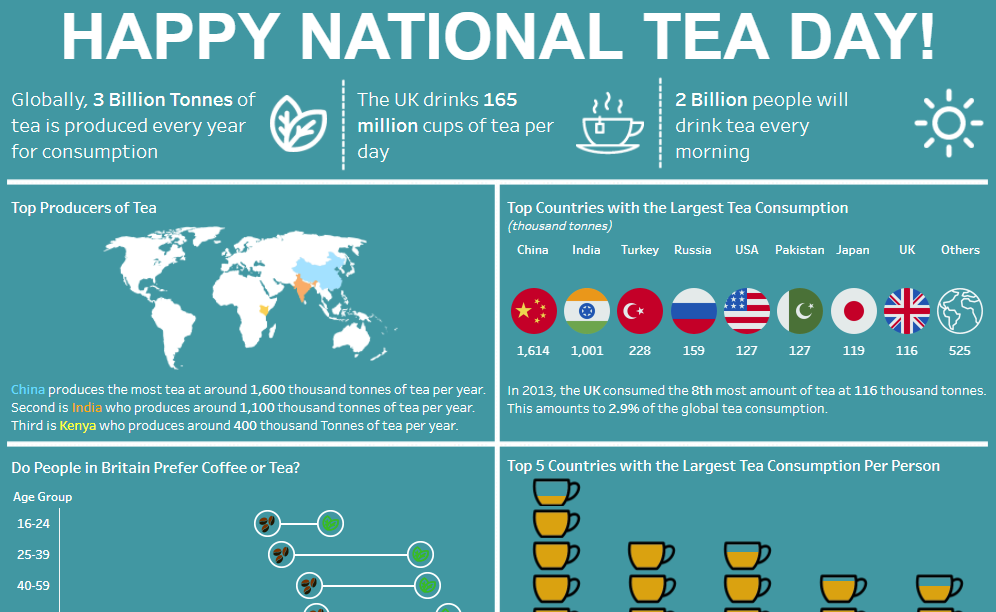
As National Tea Day in the UK is soon approaching (21st April), I thought it would be the perfect time to create a viz dedicated to tea! After browsing online, I found datasets related to the production, exportation and consumption of tea. The first dataset I found was from a report by the FAO (Food and […]
Open Data Viz: LAPD Crime Incidents by Division (2010-2017)
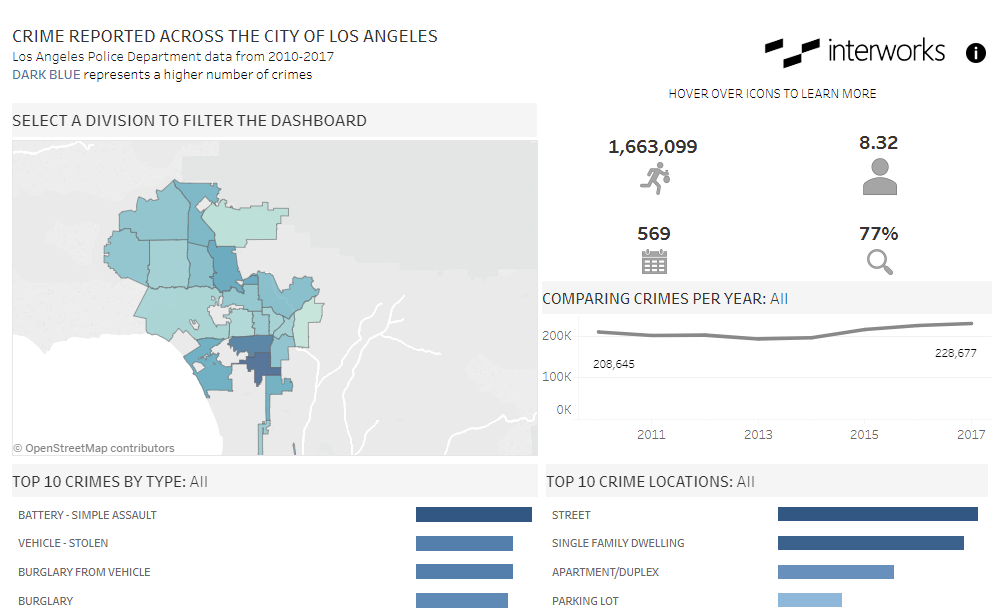
Despite the famous traffic and occasional earthquake, over four million people choose to call Los Angeles home. With warm weather, vast cultural and ethnic diversity, and Hollywood, many people want to pursue their creative dreams here. I am one of those people. Growing up on the East Coast, I dreamt of bumping into my favorite […]
