Tables in Tableau: Jazzing It Up with a Purpose, Part 3
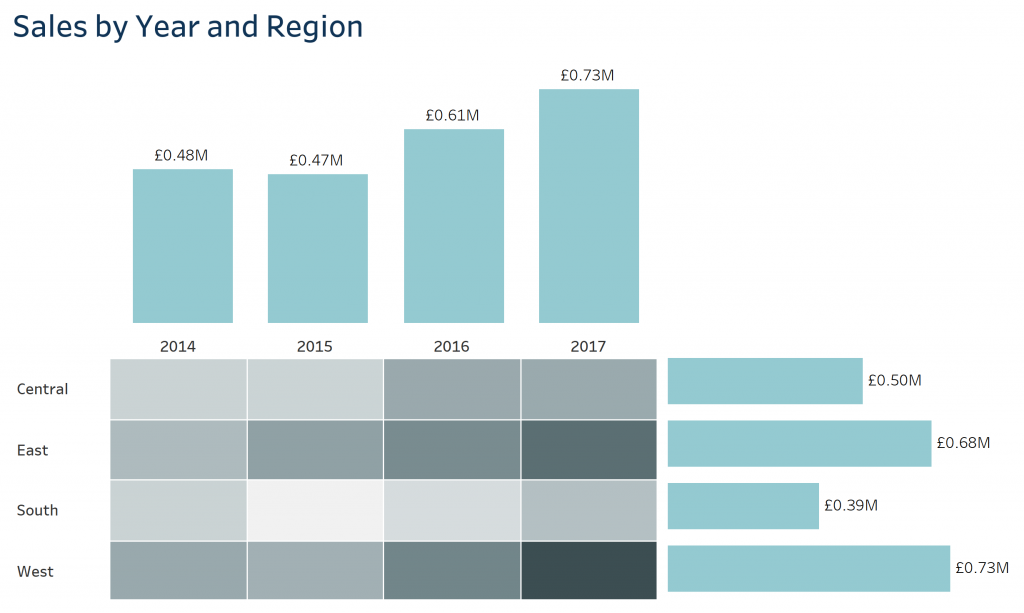
We have now reached the final part of our Tableau Tables Trilogy. For this part, we will be covering what I call the table/chart combo. Why do this? The reason is quite simple. More often than not, people consume data in a table format, spending years consuming tables in Excel, PowerPoint or even Word. So, […]
Portals for Tableau New Feature Spotlight: Dynamic Filter Updates
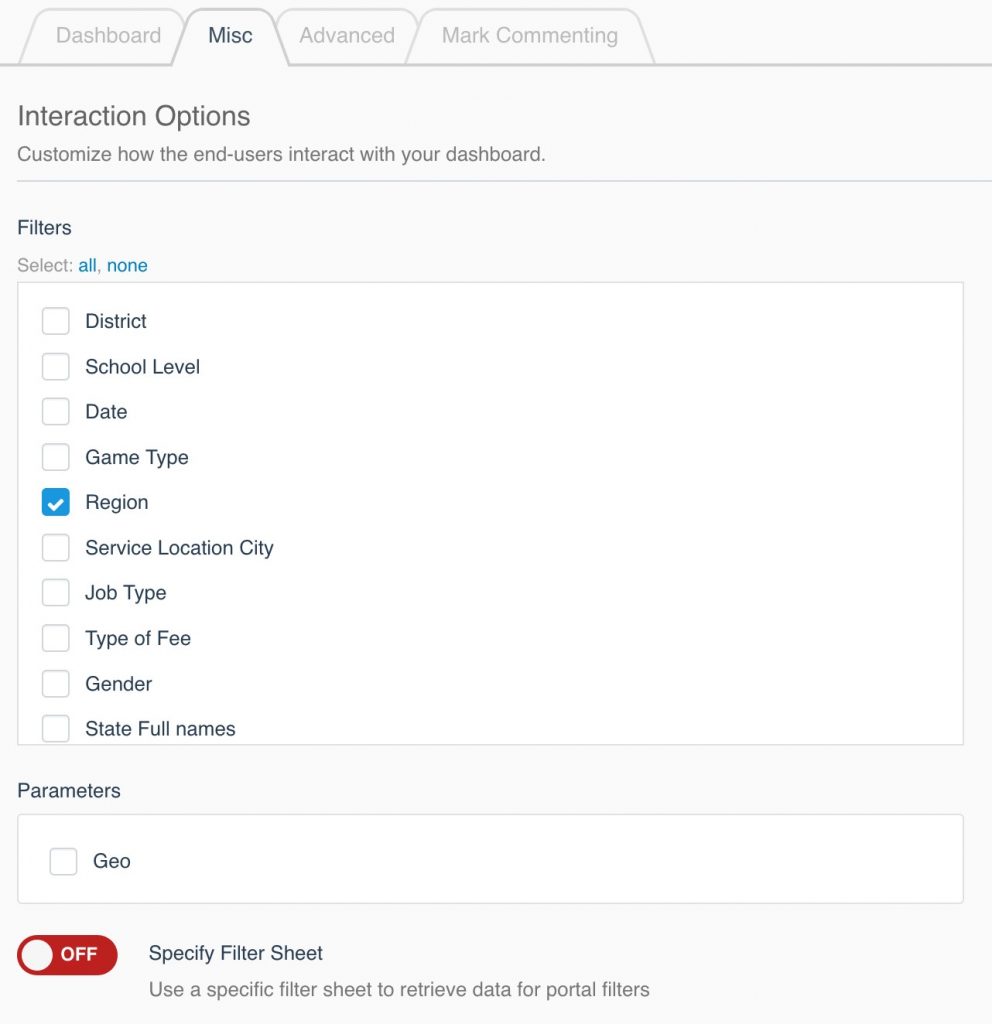
Ever wish your Portals for Tableau filters could be dynamic? Or even your portal parameters? You’re in luck! You may have seen Data Driven Filters (also works for parameters) on your portal – it even made our recap of last year’s best features. Now we’re back with a pretty big improvement, for both usability and […]
Recapping InterWorks’ London Team Day

When InterWorkers meet, we not only talk about Tableau and how to help people better understand their data, we also like to be challenged and challenge each other! This time, right after Tableau Conference Europe 2018, we were invited to join London Team Day. For those who don’t know, we have a tradition of naming […]
A Quick Overview of Embedded Analytics in Portals for Tableau
At InterWorks, we live and breathe Tableau. It is an awesome product that helps us to analyse data, draw insights and share them across all types of businesses and industries. Over the last few years, however, clients had been asking us for a public facing embedded analytics solution. Portals the platform was born! What Are Portals […]
InterWorks Blog Roundup – June 2018
Let’s be real: It’s too hot to go outside right now, so why not stay in the A/C and catch up on some reading? June featured our usual variety of useful Tableau tips as well as some really topical vizzes ranging from the World Cup to LGTBQ Pride. And what’s that? Snowflakes in June? That’s right! […]
The Internet Will Eat Me: Part 1 – Email and Browser Settings
This started as a short blog on my paranoia and quickly escalated. I am breaking it into two parts, describing a small piece of my exaggerated plunge into the depths of personal data security on the internet. If you read my last blog, you may have witnessed something profound. A few days after the last […]
Advance with Assist: Enhancing Dashboards with Custom Icons
This week’s question came from a longtime Tableau user, but they just aren’t happy with the way their dashboard looked: “The attached dashboard just doesn’t have the bang that I’m going for. Any tips you can think of to enhance it? There are maps with the issue location and the visits associated with the corresponding […]
Tables in Tableau: Jazzing It Up with a Purpose, Part 2
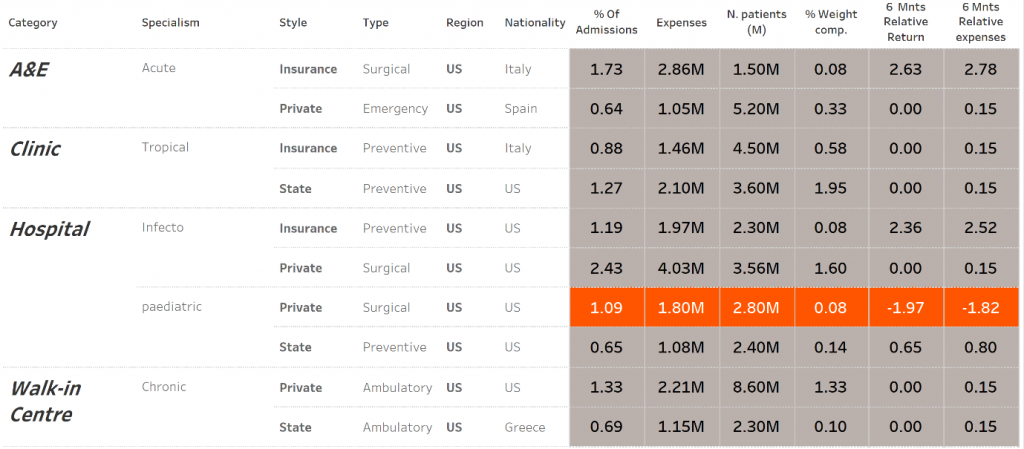
Following the previous blog post, today we will be covering several ways to display negative values in tables. My go-to option is to add colour to the visualisation to highlight the values that need attention; however, there are different ways we can use colour. As in any other type of analysis or visualisation, we must always keep […]
PYD61 – Alteryx Inspire 2018 Recap

It’s officially conference season! Following up our TC2018 Europe previews (Part 1, Part 2), we’re wrapping up Alteryx Inspire 2018 with InterWorks’ Alteryx Practice Lead & Alteryx Ace Michael Treadwell and Analytics Consultants Chris Sanders and Russ Lyman. The team came back with some great highlights and interesting takeaways into the future of not only […]
Tableau Server or Online? ServerCare Is the Best of Both.

Tableau Server is the enterprise platform software for publishing, securing and distributing the content (dashboards and data sources) created by Tableau developers. It can be installed on a standard Linux or Windows Server in your data center, private cloud or public cloud (AWS, Azure, etc.). Tableau Online is Tableau’s SaaS offering for Tableau Server. You […]