Advance with Assist: Blending with Dimension Not Utilized
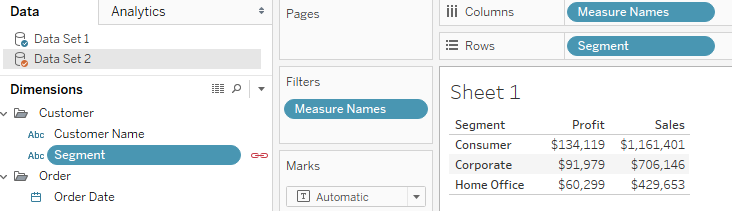
Question: “I’ve established the data relationship, but the number still won’t show and I still get this error. What am I doing wrong?” Blending is one of those features that we see many issues with. Some users don’t realize they’ve started a blend while others may have unknowingly blended on a field that Tableau automatically […]
InterWorks Quarterly Event Debrief: Q2 2018

The InterWorks Events Team has been quiet over the last few months, but that’s not due to inactivity! Rather than continuing our Monthly Event Recaps, we decided to give you a wrap up of our events for each quarter. So, without further ado, let’s dive into Q2. Our Brewalytics series throughout the U.S. went off […]
Hidden in Plain Sight: Why You Should Use a VPN

On a recent early-morning bike ride with a good friend and co-worker, I found myself defending my choice to use a VPN on all my personal devices. I realized that my arguments were anything but iron clad and while I could mentally justify the added protection, I could not even begin to explain why I […]
Transforming Data in Tableau Prep
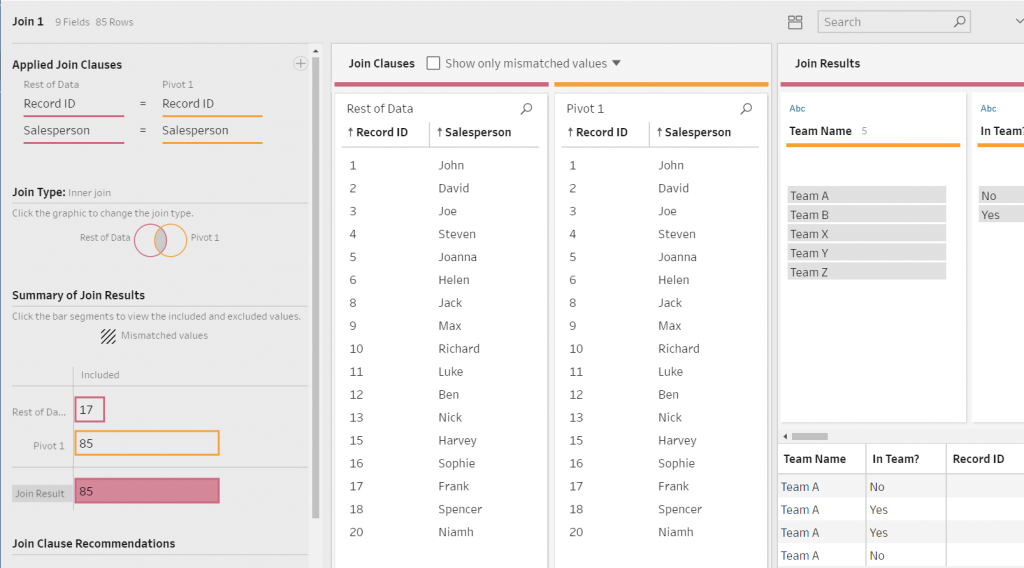
Picture this: You are trying to build a sales dashboard in Tableau Desktop to show your boss how great you are. But hey, there is one issue: The data you have is currently in a structure not suitable for Tableau Desktop. You need to crosstab or pivot the data on several measures and dimensions. The […]
Five Big Takeaways from the 2018 Culture Summit

Anytime it is 110 degrees in Oklahoma, it’s a good time to get the hell out. I was lucky enough to attend this year’s Culture Summit in beautiful (and much cooler) San Francisco, California. This cross-industry conference focuses on ways to increase employee engagement and build high-performing teams. It’s sponsored by some of the engagement […]
Flipping the Script: How Starting Small and Specific Changed My Human Trafficking Data Viz
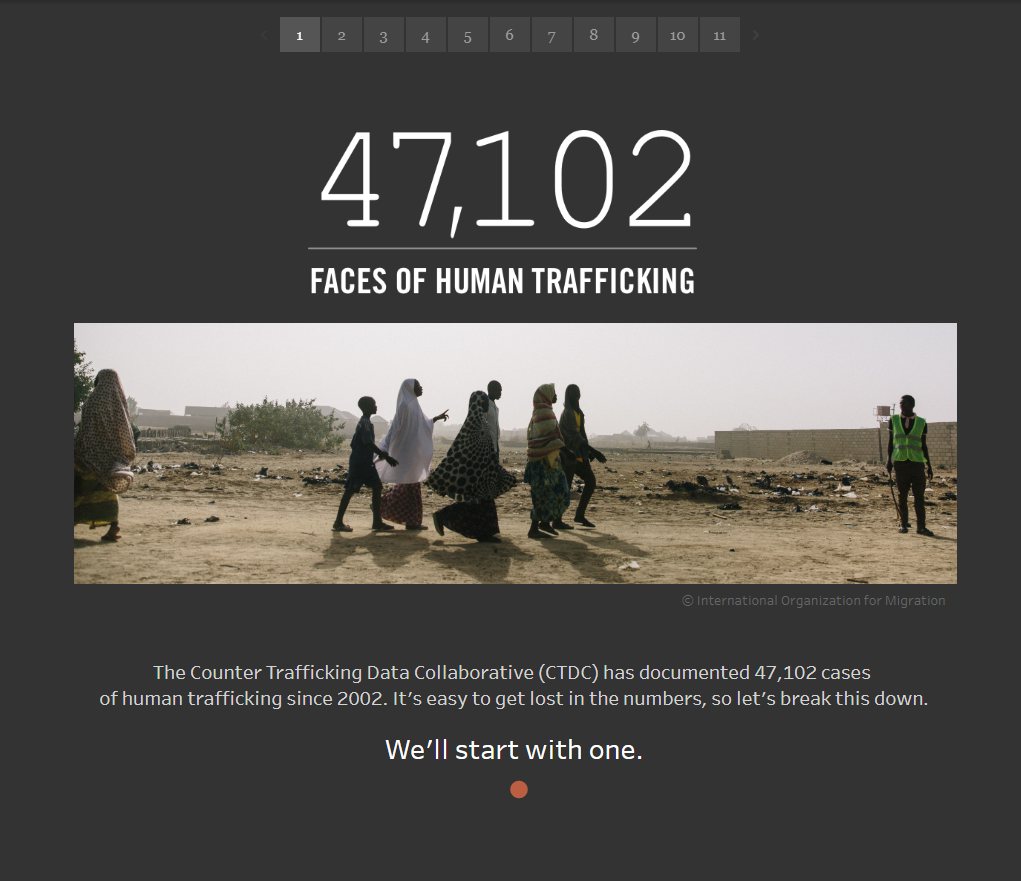
Normally when I build a dashboard, I approach it like a funnel: I start with the big picture first and then narrow into more specific details. This allows viewers to establish context and get the most important insights right from the start and then choose how deep to dive into the details. But when I […]
PYD63 – Datasaurus Rex David Murphy

First-time host and InterWorks’ representation in Singapore Jia Liu stomps around with Datasaurus Rex David Murphy. David is from England but seized the opportunity to travel the world and ended up in Singapore, where he works and co-leads the Singapore Tableau User Group. Find out what motivates him, what are some similarities and differences being […]
Advance with Assist: Custom Subscriptions with Tableau Server Custom Views
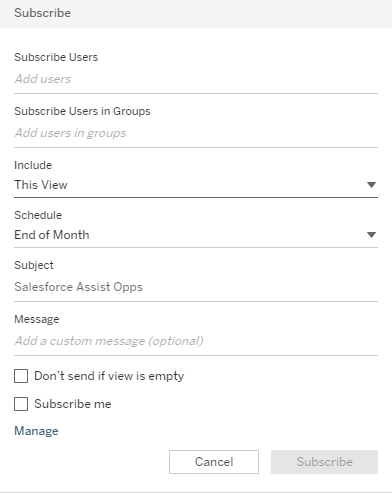
Question for this week: My users love the dashboards, but they want to get an email with the dashboard filtered to their specific options without having to click the filter. Can we set up a script to send an email to the user with their dashboard needs being clicked automatically? Over the years, I’ve seen […]
Portals for Tableau New Feature Spotlight: On-Premises Analytics Tracking
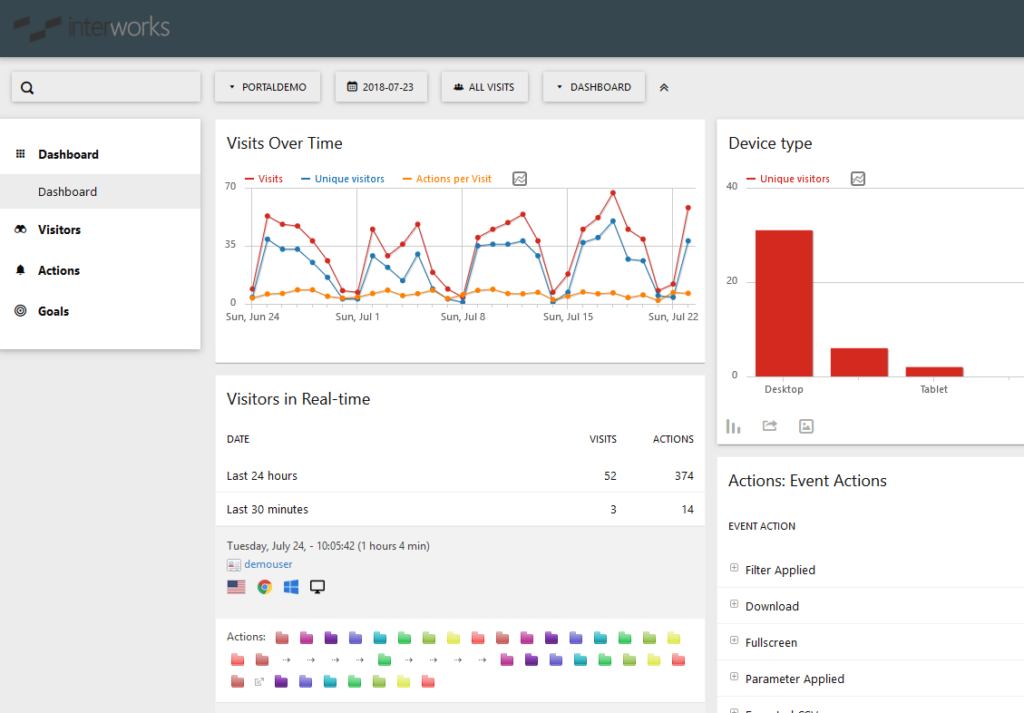
Everyone is familiar with Google Analytics for tracking web usage. However, some organizations have policies that don’t allow for that data to be collected by a third party or don’t like Google Analytics for some other reason. For instance, maybe Google Analytics forgot to send you a birthday card last year and you haven’t forgotten. Whatever […]
The Basics of Loading Data into Snowflake
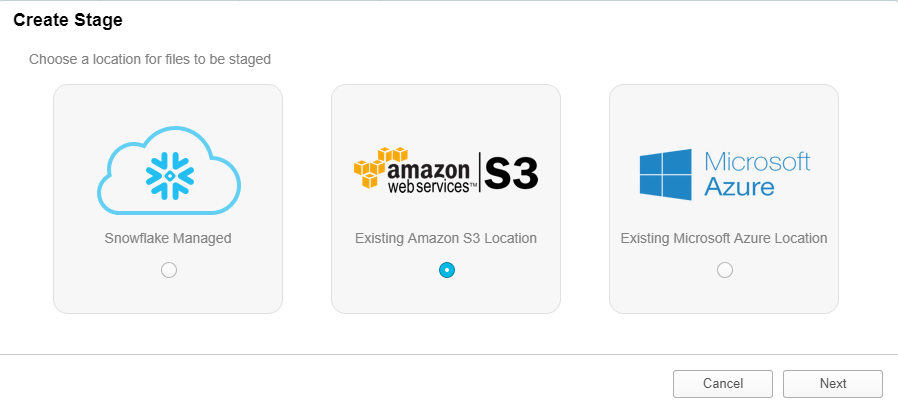
For the second post in my continuing series on Snowflake, I wanted to expand on some concepts covered in my JSON post. Last month, I walked you through how to work with JSON in Snowflake and discussed the process Snowflake uses to flatten JSON arrays into a format that can be easily queried. For this […]
