Creating a Scorecard in Portals for Tableau
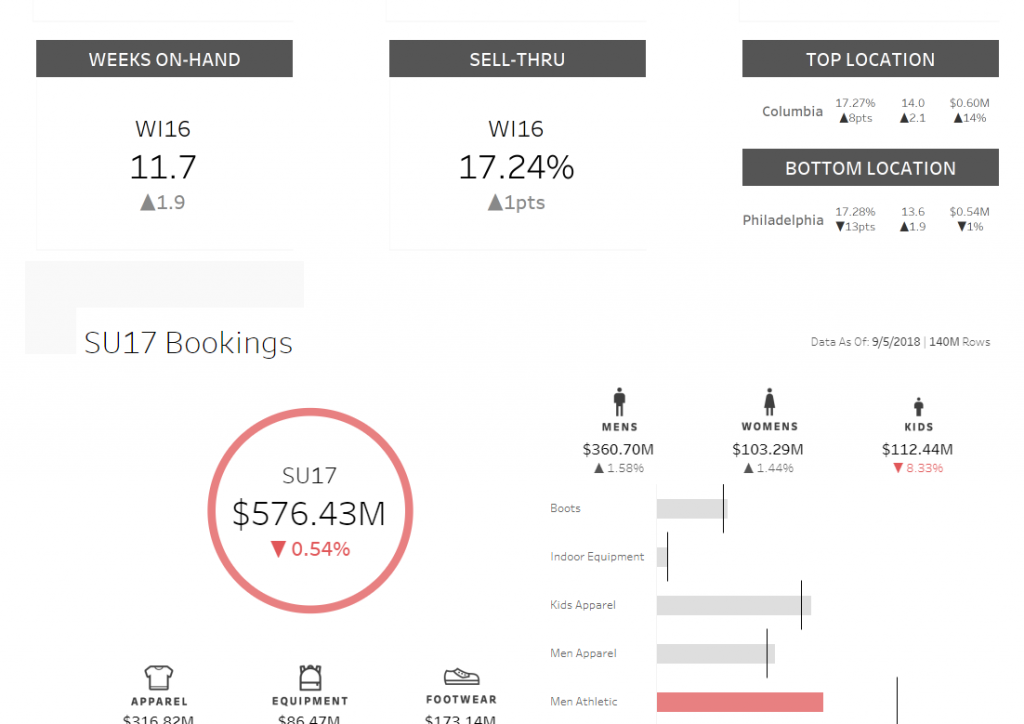
Scorecards are used to observe KPI’s over time, are incredibly valuable for real-time business insights and are available for use in Portals for Tableau! This post will go into how to create the example below: Before you begin, make sure you have Tableau Desktop, Tableau Server and Portals for Tableau. If you don’t have […]
Viz for Social Good: United Nations Development Program
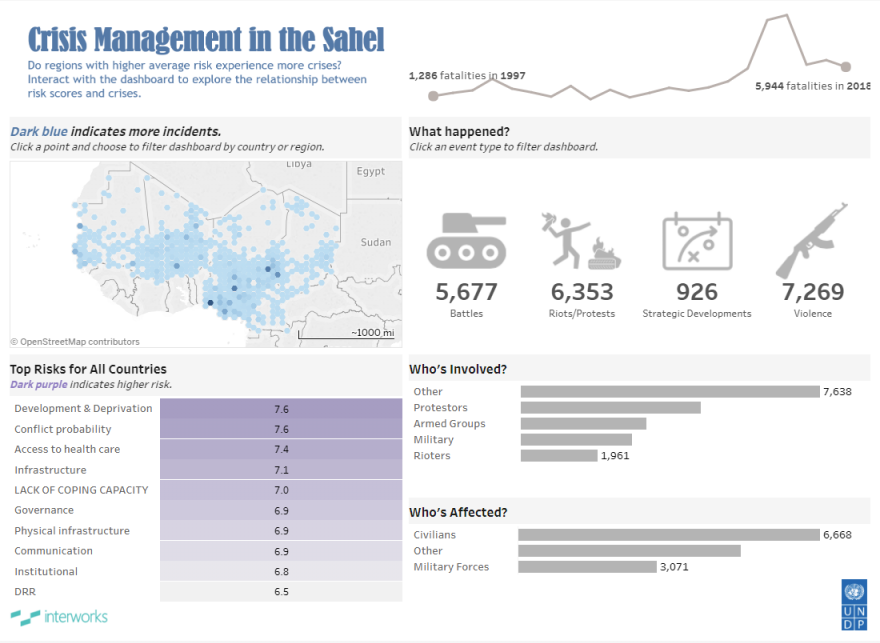
Yet another great project came out this month from the folks at Viz for Social Good. This time around, we’re exploring data from the United Nations Development Programme to help build a crisis risk dashboard to assess risk and crises in the Sahel region of Africa. The project consists of two data sets: one listing incidents […]
A Quick Exasol Script for Building Python UDFs

A client recently had a challenge wanting to use Exasol’s User-Defined Functions with a Python script, but they were having a hard time coming up with the right syntax to get it working properly. There’s a good deal of documentation out there, though much of it seemed a bit convoluted or difficult to comprehend. I’m […]
Portals for Tableau New Feature Spotlight: Workbook Tabs
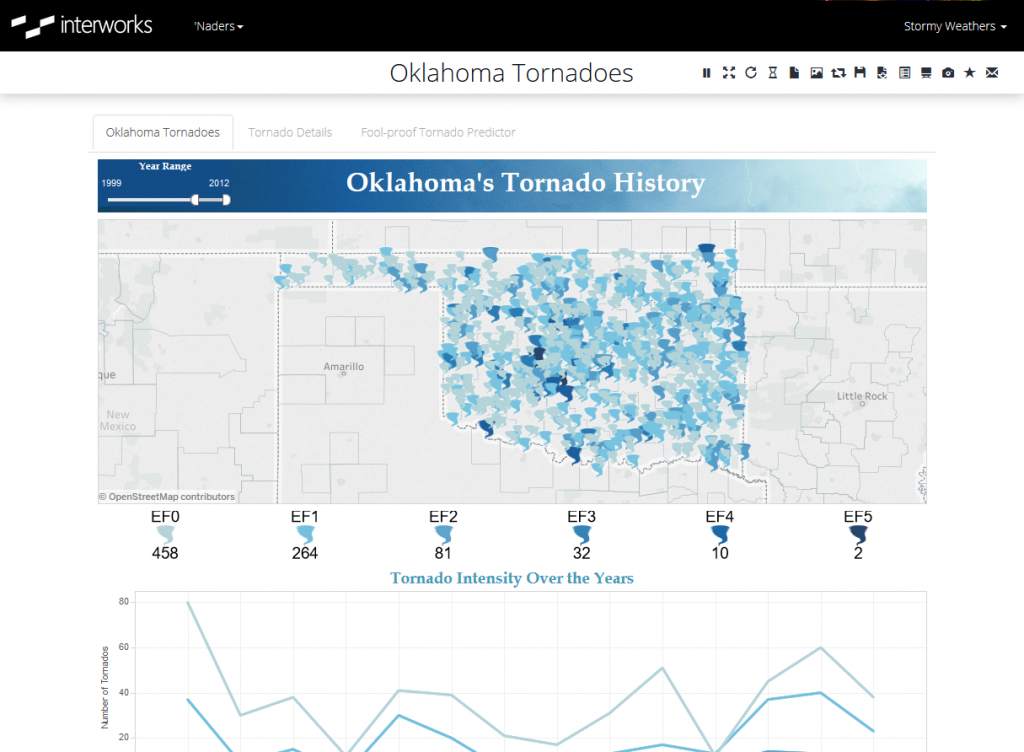
Portals for Tableau have had the ability to show a sort of live view of the workbooks and dashboards within those workbooks as a part of the navigation for a while now (see this post for more info); however, the portal treated each dashboard as a separate entity. We’ve now added the ability to show […]
Questions from Tableau Training: Union File Names as Years
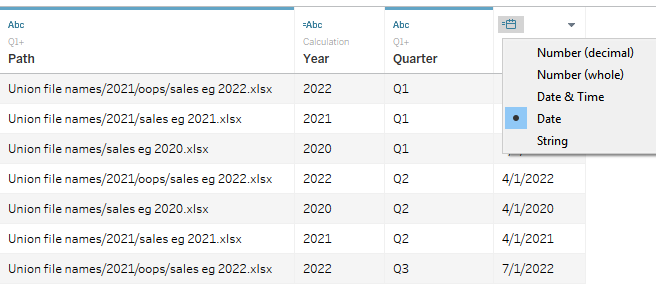
There is an example we do in the Tableau Desktop Intermediate course to look at how to union your data. In the example, we use Tableau’s Union function to append different sheets, labeled as different quarters, from a single Excel file into one long table in Tableau. My quick-thinking class the other week immediately wanted […]
Using Python to Add External Data to Your Reporting Environment
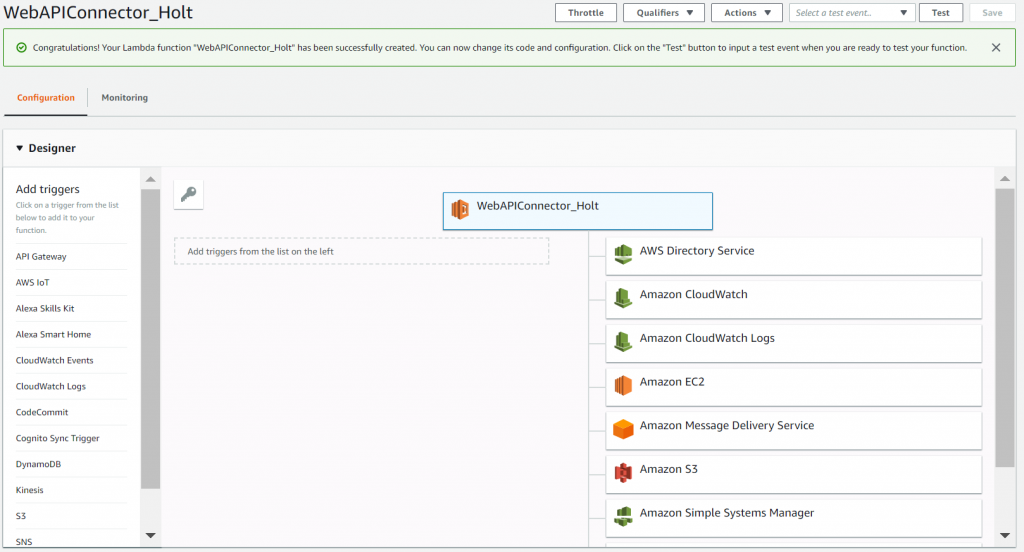
Python is quickly becoming the first programming language exposed to non-tech folks. While working on my data pipeline, I found a perfect example of how you can use Python to bring external data into your reporting environment – especially when the host of this data doesn’t have an out-of-the-box database connector. Above: What I think […]
PYD66 – Sports and Data with George Chahrouri of Pro Football Focus

ARE YOU READY FOR SOME FOOTBALL?!? It’s officially football season, meaning armchair quarterbacks, pick six packs, and, of course, fantasy football! George Chahrouri of Pro Football Focus joins our panel of sports nuts led by Chris Sanders to talk about collecting data on every player on every play in every game, analyzing that data, and […]
Disney Data & Analytics Conference 2018: Sharing the Magic

We have a few (super) fans of Disney here at InterWorks, including me, so it was natural for us to be curious about what was going on at the Disney Data and Analytics Conference this year. A small InterWorks team took on the hard task of infiltrating the happiest place on earth and finding out […]
Advance with Assist: Parameter Performance Optimization
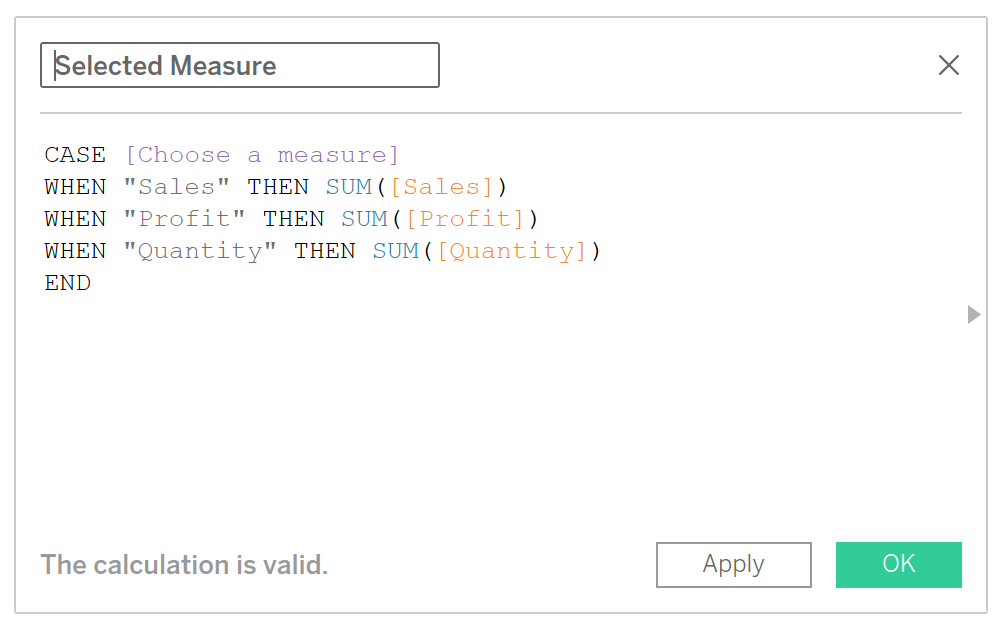
Question: “I added a calculation that uses a parameter input and my dashboard is a lot slower now. How can I make it faster?” Example Calculation Some common reasons to include user-selected values (parameters) inside of calculations are: Change the measure displayed Set a date for comparison to current values Find points within a certain […]
InterWorks Blog Roundup – August 2018

Tableau purchased Power Tools in 2019. Contact Us for more information. The InterWorks blog record books have been broken. With a whopping 46 blog posts and 32 contributors, it’s safe to say our crew delivered the goods in August. For you, this means a whole lot of knowledge just waiting to be absorbed. Tableau vizzes, […]
