How InterWorks’ IT Service Model Is Different
Most IT service providers have a set menu of offerings you can choose from. They define exactly how their technology will be delivered, and they don’t make exceptions. That makes sense for them, but it doesn’t really take the needs of the customer into account. The customers’ needs are usually tied to broader goals, and […]
Map Out the College Search with Tableau
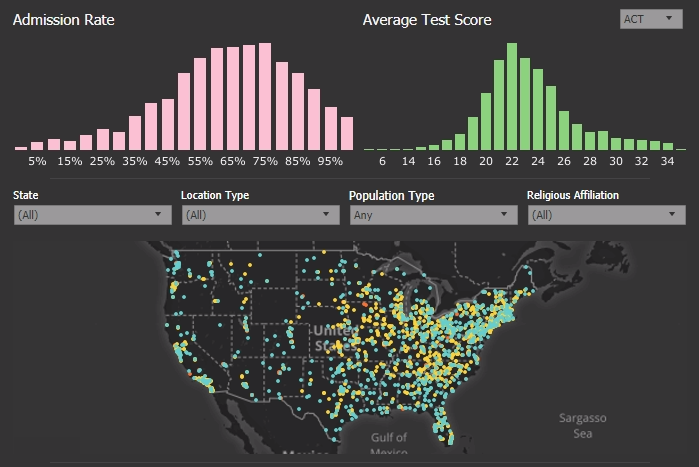
I went to the University of North Carolina at Chapel Hill for my undergraduate degree, and it was one of the most rewarding experiences I’ve ever had. However, it’s surprising to me that I ended up in North Carolina, having grown up in New Jersey. When it came time for college, I really had no […]
Level Up Your Analytics with Dataiku on Windows
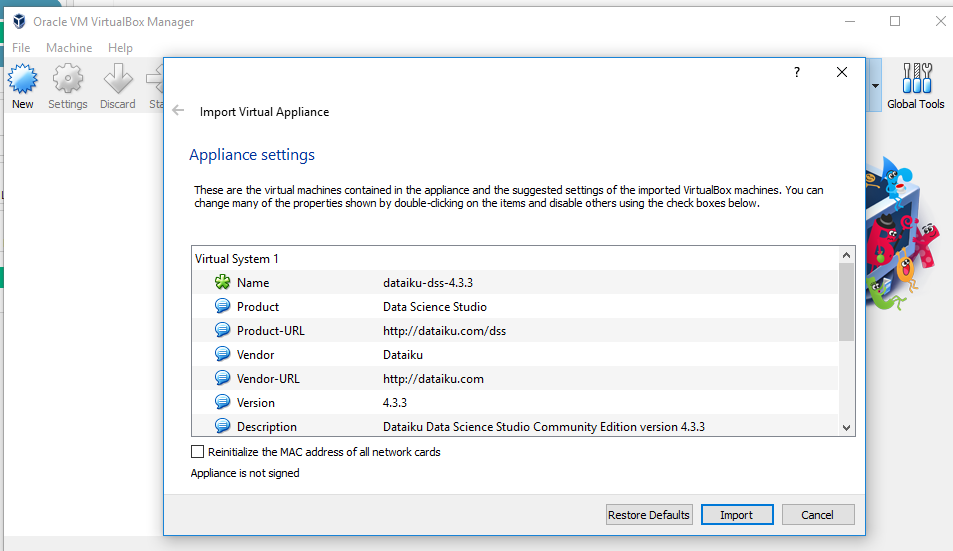
Sometimes you find a tool that blows you away with its capabilities and get eager to utilize it in your day-to-day work with data. Dataiku was one of those for me. It doesn’t run on Windows natively, but the process to install the virtual system so that I can use Dataiku on Windows was painless. […]
PYD70 – Debating Dashboard Design

You want your hard work to get noticed, right? When it comes to designing visualizations and dashboards, getting your work noticed and making it useful have typically come with some sort of sacrifices on both sides. In this week’s show, Robert, Mike and Ben discuss just this topic: the philosophy behind designing dashboards for fun […]
Advance with Assist: Changing Default Properties on Data
The question is: We receive CSV files from our data provider which we pull into Prep. We then unionize them and output a Tableau online server file. Why can’t we edit the default properties? If you are familiar with this menu, it normally looks like this: Many times when connecting to new data sources in […]
The Spatial Join: New Horizons in Mapping Tools
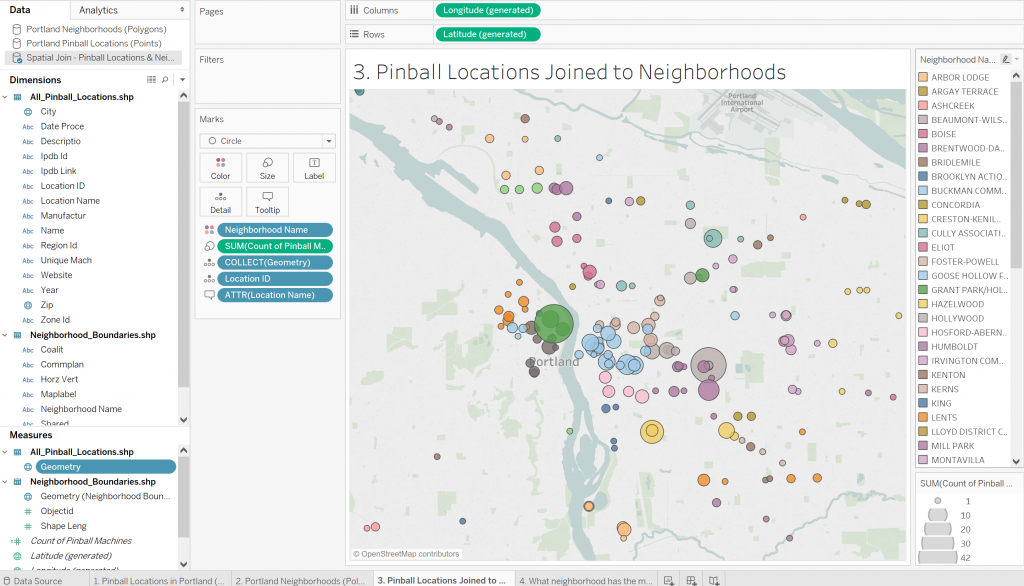
Hey, party people! Guess what time it is? It’s Mappy Hour! via GIPHY Tableau has been cranking out new mapping features left and right, but few have had me as excited as the spatial join with the release of Tableau 2018.2. This is the mapping tool I’ve been hoping to see in Tableau for a long […]
PYD69 – Tableau Conference 2018 with David Pires Part 2

As Tableau Conference 2018 draws closer, we can barely contain our excitement about connecting with you in New Orleans! To help channel our enthusiasm, here’s the second part of our Tableau Social Media Ambassador David Pires’ conversation with several speakers and attendees who are just as pumped for this year’s TC as we are. In this […]
The Story Behind the Remix
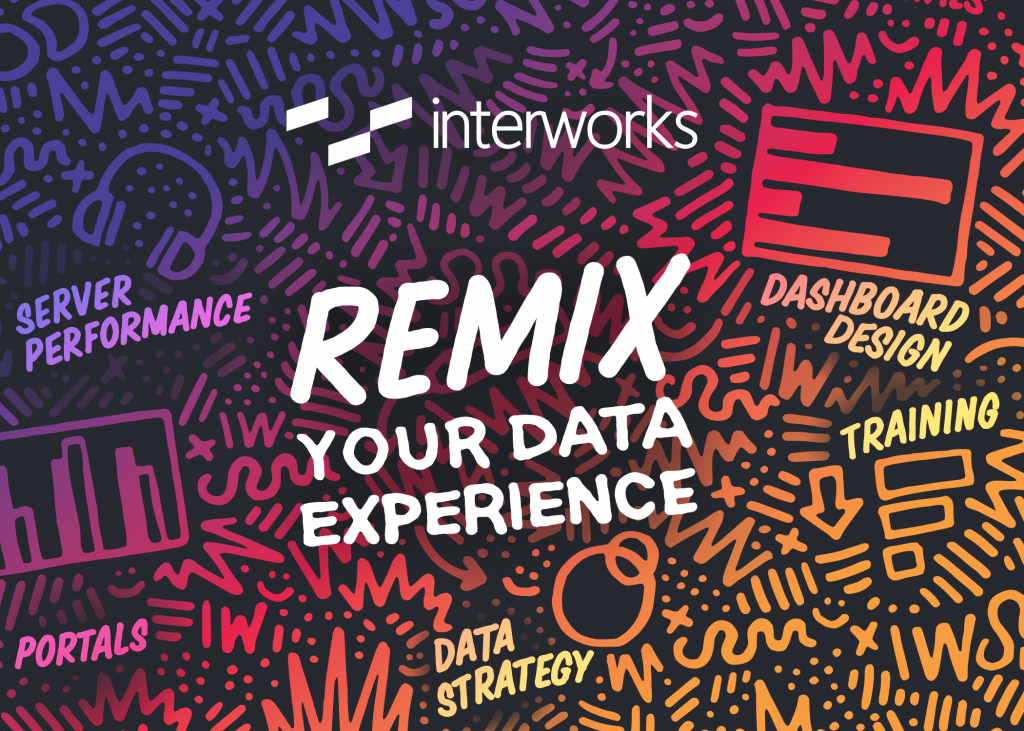
This week, InterWorks is unveiling our theme for Tableau Conference 2018: “Remix Your Data Experience.” Deciding on a theme was a process spread out over the better part of a year, and it’s an immense delight to finally be able to share it with the data community. Countless conversations, brainstorming sessions, revisions and questions paved […]
Lagniappe from Locals: A TC18 Experience Guide for NOLA

Imagine you’re hanging out in Vegas during Tableau Conference 2017, soaking in every last minute of the excitement of conference week. Imagine you’re maybe a little sleepy…it has been quite a week, after all. Then imagine, if you can, that you find out the news: TC18 is going to be in your home state. Your […]
Questions from Tableau Training: Moving Column Headers to the Top of the View
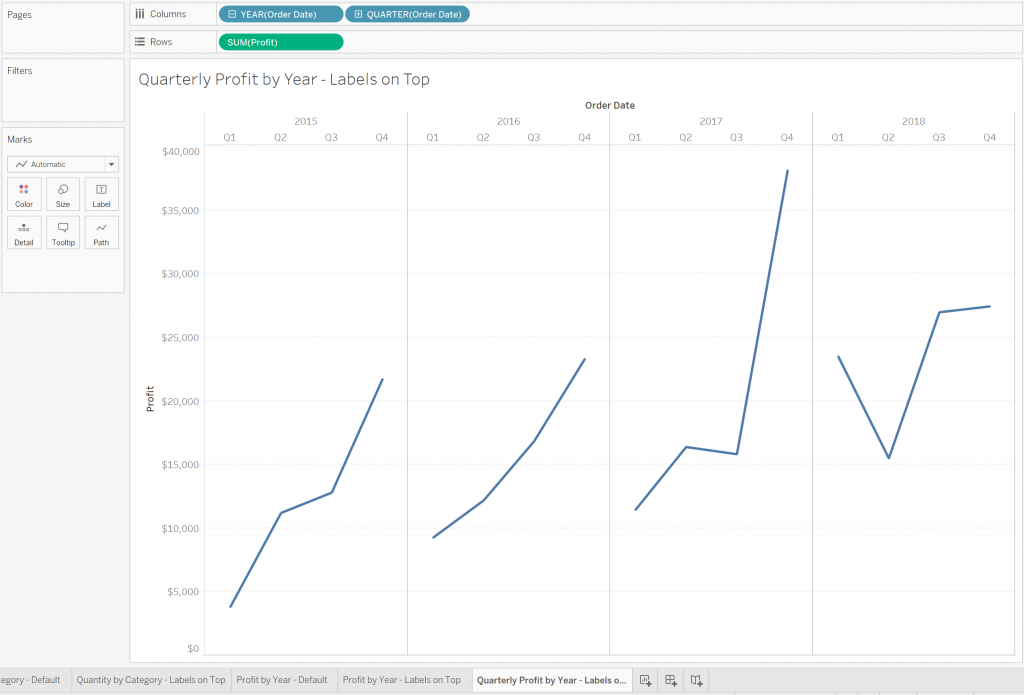
“Tableau is an Excel complement, not an Excel replacement.” Whenever I teach a training class, I make this point multiple times throughout the course. Each tool has its own set of specialties and comparative advantages that should govern usage. Or, put more simply, there are situations where Excel is the best tool to solve the […]
