Synchronize Axes Across Multiple Sheets in Five Simple Steps
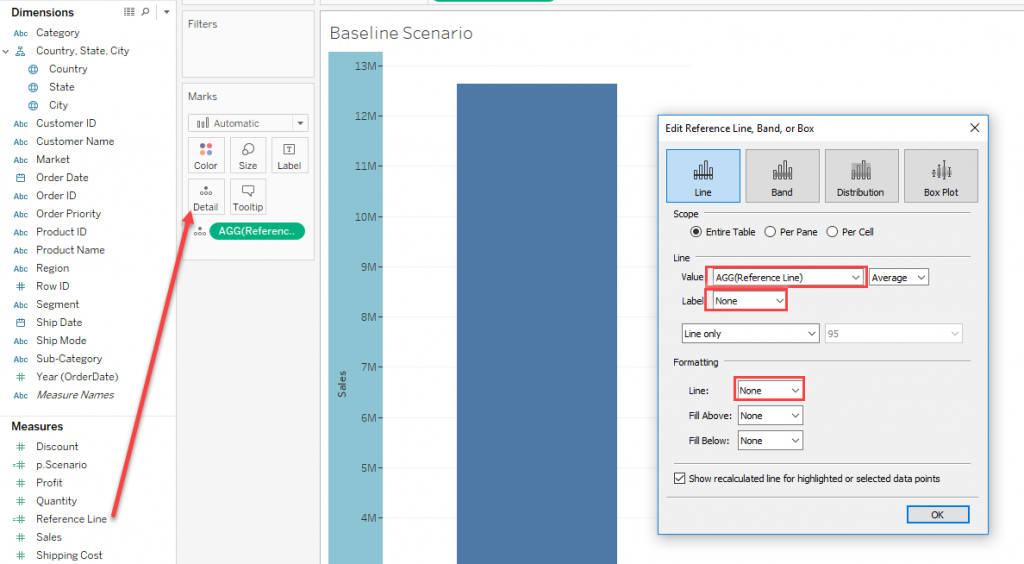
I often find myself building dashboards with a parameter to compare baseline data to different scenarios. Because these scenarios are built out in different worksheets, I am faced with the challenge of correctly displaying changes in results compared to each other. In the mocked-up example below, you can see how the axes change dynamically within […]
WEBINAR: Tableau Server 2018.2+ Updates

Starting in version 2018.2 for Windows, Tableau Server comes with some very exciting features, especially if you’re a server administrator. Collectively named TSM, Tableau has included new management tools, improved administrative interfaces, and better configuration-change handling. These will impact every aspect of your Tableau Server administration and maintenance processes going forward. If you’re not prepared […]
WEBINAR: Transitioning Your Tableau Platform to the Cloud – Part 2

Transitioning your Tableau platform to the cloud has huge benefits, but that process can come with lots of questions and uncertainty about best practices. This webinar features some InterWorks experts who answer those questions and help you chart a path for data migration. Solutions Architect Matthew Brimer and Tableau Server Practice Lead Tony Kau present […]
WEBINAR: Transitioning Your Tableau Platform to the Cloud – Part 1
Hosting your analytic platform in the cloud is the next stage of data analytics, and now is the time to migrate that data. InterWorks Solutions Architect Mat Hughes and Data Practice Lead, Brian Bickell, lead a webinar on how deployment can advance your business and enhance your data practice, including the benefits of more flexible […]
My First InterWorks Summit Experience

I had been at InterWorks for approximately six weeks when the weekend of Summit arrived. Knowing very few people outside of my immediate team, I was a bit nervous to see what a weekend filled to the brim with new folks was going to be like. But I am pleased to say that my expectations […]
Quantified Office: MinterWorks, Inc.
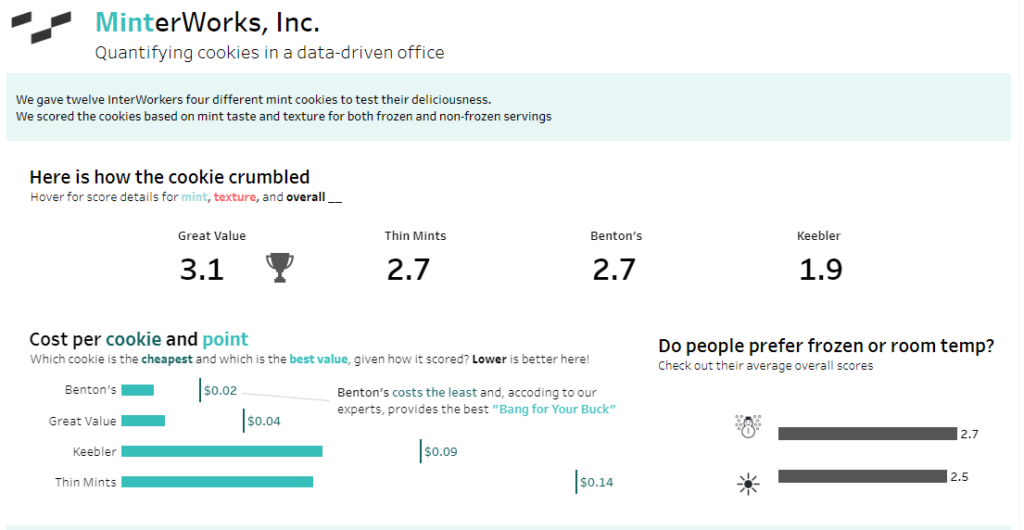
Do you ever have those watercooler debates at work that never get a real sense of finality? A coworker claims the trade OKC made for Carmelo Anthony was worth it, and you know in your heart that they are completely wrong, but you keep it civil. That’s the type of scenario that faced my section […]
VMware vSphere 6.5+ Bug: Folder Removal
Recently, it came to our attention that a defect was identified in the VMware vSphere HTML5 User Interface on VMware 6.5 and above. Simply put, if a VM folder is selected and you choose Remove from Inventory, VMware processes this as a recursive delete operation in the backend. VMware Labeling We quickly started testing this […]
Visualizing Financial Statements in Tableau
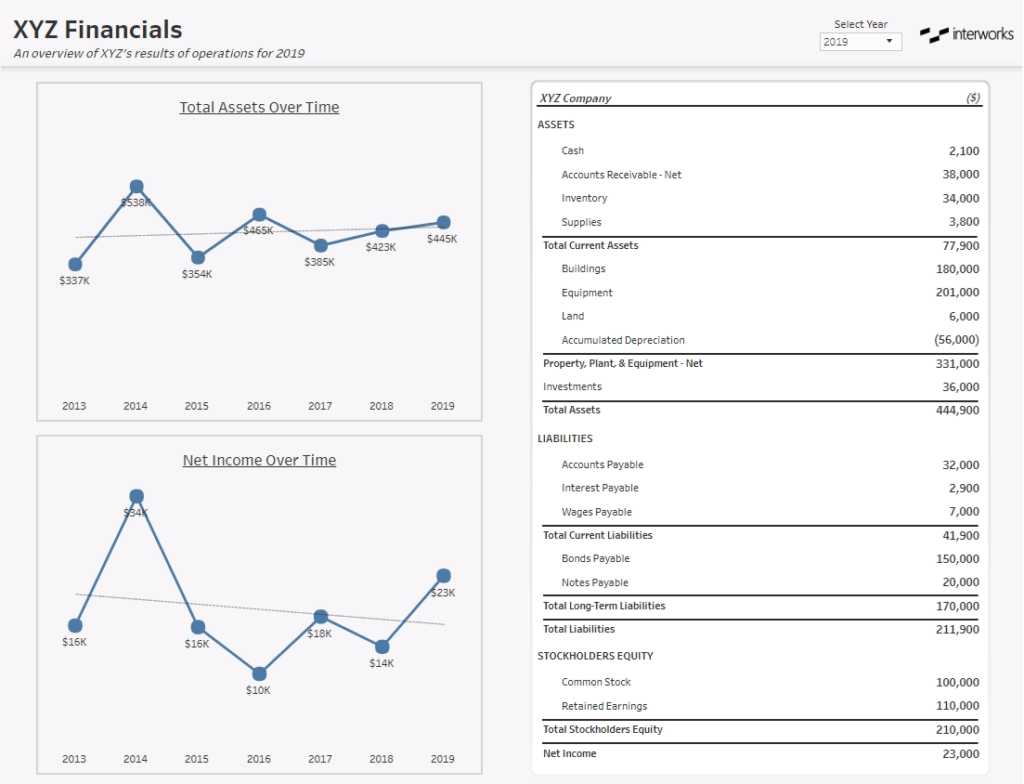
Visualizing financial statements is hard. While not inherently a difficult task, when I speak with many of my clients’ financial teams, their data tends to be some of the most sensitive that the company possesses, and for that reason, its presentation is very particularly curated. Because of the clearly defined ways companies must disseminate this […]
Data Goals for 2019

Happy New Year to all the readers of the InterWorks blog; 2018 has been a whirlwind of a year! In 2018, InterWorks steadily provided value to our clients in the data space, and as we kick off 2019, it seemed appropriate to prep you guys on what we have up our sleeve in the new […]
InterWorks Blog Roundup – December 2018
Last month, we were walking in a data wonderland over here on the blog. This list of December content (don’t worry, we checked it twice) highlights 17 pieces and over 50 contributors—plus, one post alone that showcases 41 people!—and includes awesome resources pertaining to Tableau Prep, embedded analytics and more. Check out the features below, […]