
Tableau recently introduced the viz in tooltip feature to Tableau Desktop, allowing users to add a whole new level of detail to dashboards and worksheets. For those who have been using Tableau for a while, you are already familiar with the impact a strong tooltip can have on your work. For those who are newer and unfamiliar with the power of tooltips, please check out this blog post from Brooks Barth.
Building on the functionality of the original tooltip, we can now embed entire Tableau worksheets into the tooltip, making the opportunities endless. In this post, I am going to walk you through how to set up a worksheet to use the viz in tooltip feature. In addition to this, I am going to show you how to incorporate that tooltip into the overall dashboard filtering structure, which requires a little custom maneuvering.
Use Viz In Tooltip
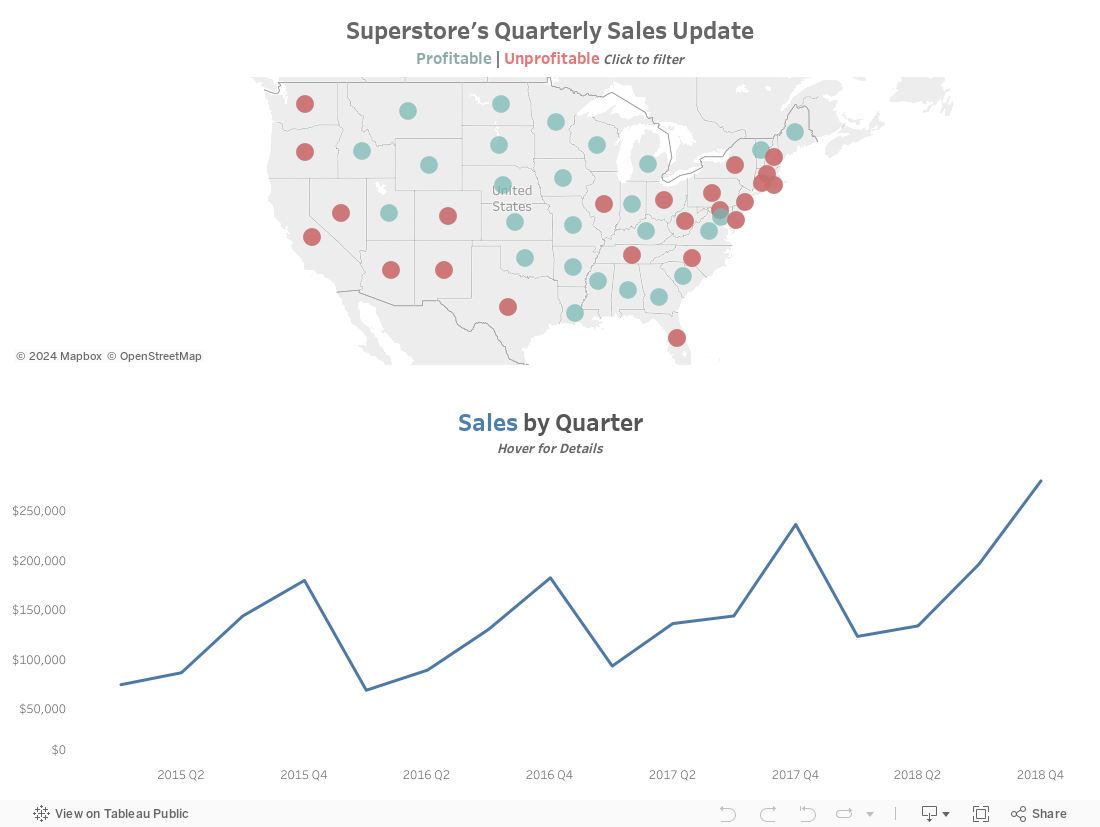
To embed a sheet into our tooltip, the process is integrated very well into the standard tooltip formatting window. I am going to demonstrate how to use the viz in tooltip by walking you through adding it to a small dashboard I made for this purpose called Superstore’s Quarterly Sales Update:
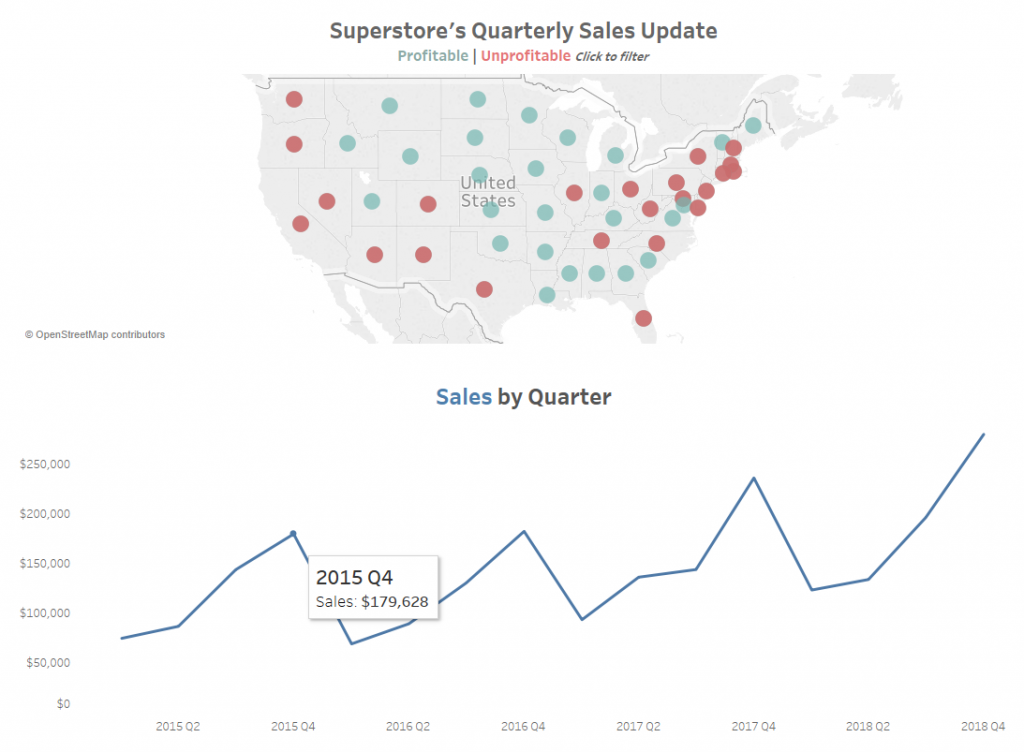
This dashboard shows our users the sales for our Superstore broken down over recent quarters, with the added functionality to filter the line chart by selecting a state. The information that this provides is not bad. Here’s where we make it better and play with the tooltip!
My vision for this dashboard is for the users to not just find out how they have been performing but to pull information out of this that will affect the decisions that decide how they will perform. Cue viz in tooltip:
What Value Would a Tooltip Viz Add to My Dashboard?
This may seem like a silly question, but it is always important to ask yourself this prior to adding anything – especially if the main driver is the new feature. Since I’m closer to 10 years old than 40, I love nothing more than shiny new toys. While new stuff is great, these new toys can take away from your overall design if not implemented properly.

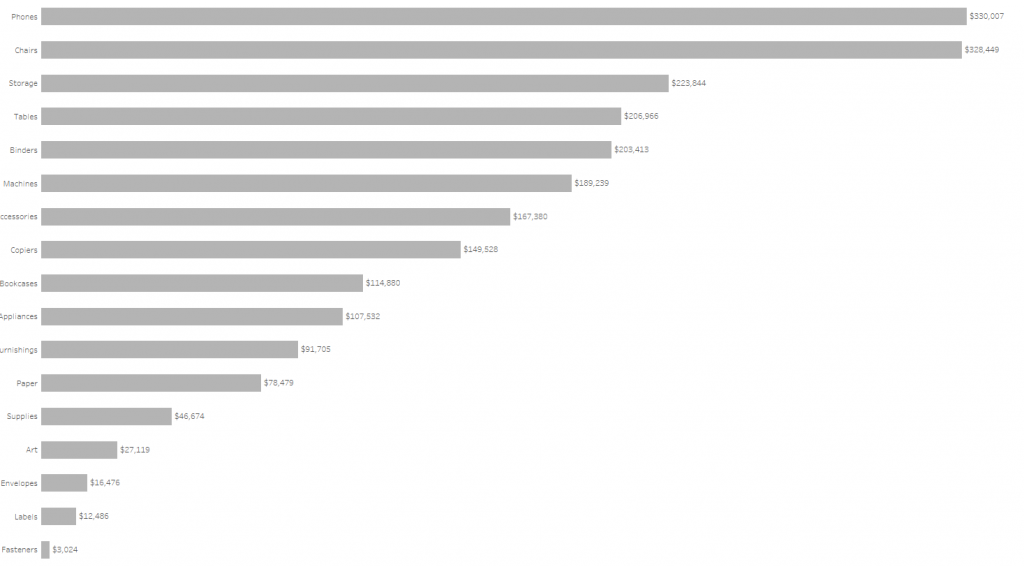
To get the most out of this dashboard, I am going to provide my users with the subcategories that are driving their sales. Adding this will allow them to not only see what their sales were but what subcategories drove those sales so they can invest appropriately for the future! To avoid distraction in the tooltip, I will use a bar chart to present this information. I built this sheet named Tooltip Subcategories:
How Do I Put This Sheet in My Tooltip?
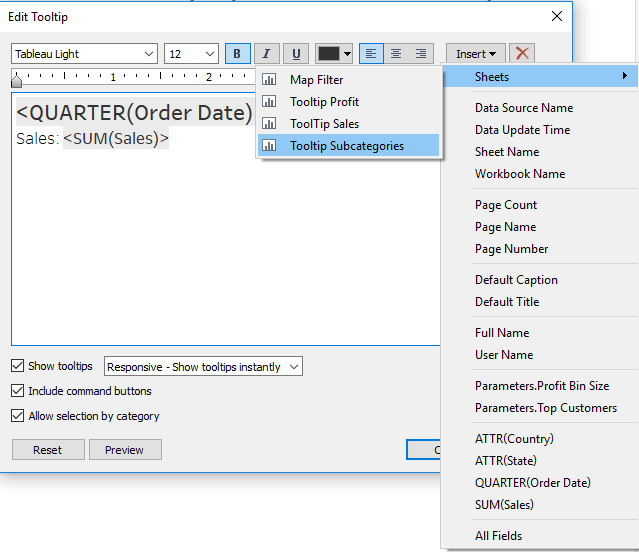
Luckily, like I mentioned earlier, the actual embedding process is quite simple. To embed this sheet into our tooltip, all I have to do is navigate to the tooltip Marks card. Once in the formatting window, we have the option to insert sheets. I can then select my Tooltip Subcategories sheet:
After submitting this change, my tooltip presents my users with a bar chart outlining what subcategories made up Superstore’s sales. To follow best practices, I updated my worksheet’s title to let my users know there is more information hidden in the tooltip:
Filter Viz In Tooltip
The Tooltip Filter
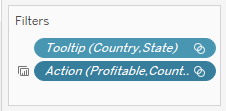
One of the greatest features that come with viz in tooltip is the tooltip filter. The tooltip filter does a great job updating that tooltip viz’s contents. An example of this is displayed above when the tooltip sheet presents information relating to 2018 Q4. This is awesome for that initial view or if you are working with a worksheet that will not be filtered itself. Where the tooltip filter begins to fall short is when the sheet your tooltip viz lives on is included in a dashboard action.
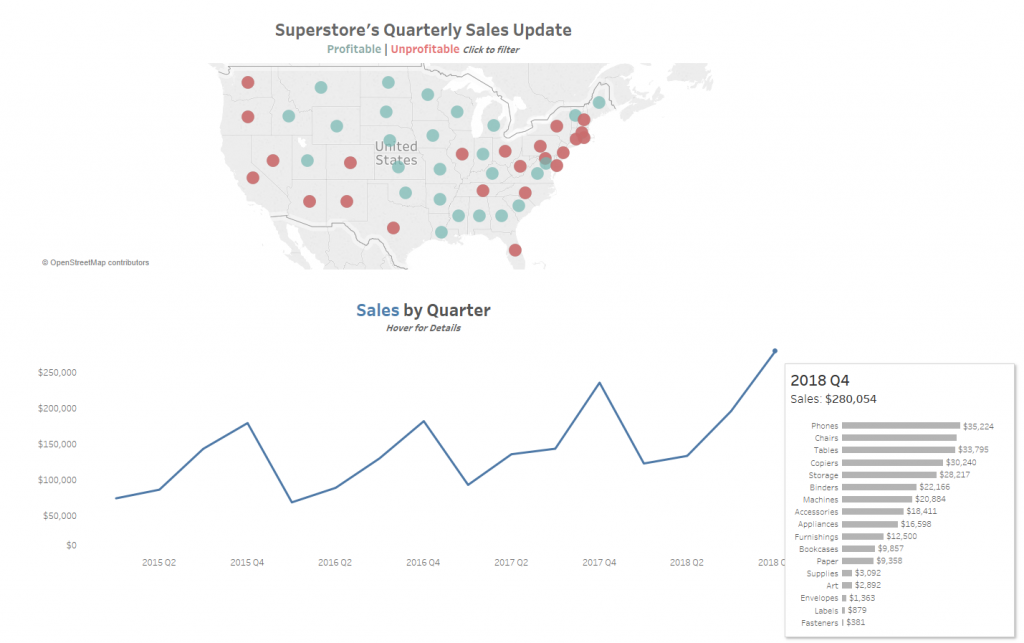
Due to the tooltip filter only being able to communicate with information dictated by the sheet it is a member of, we can sometimes be left with a tooltip viz that references the incorrect data. Here is an example: When I filter my dashboard by selecting a state, my tooltip sheet is clearly incorrect. The sales figure for phones remains at $35k regardless of whether we’re filtered to Texas or not:
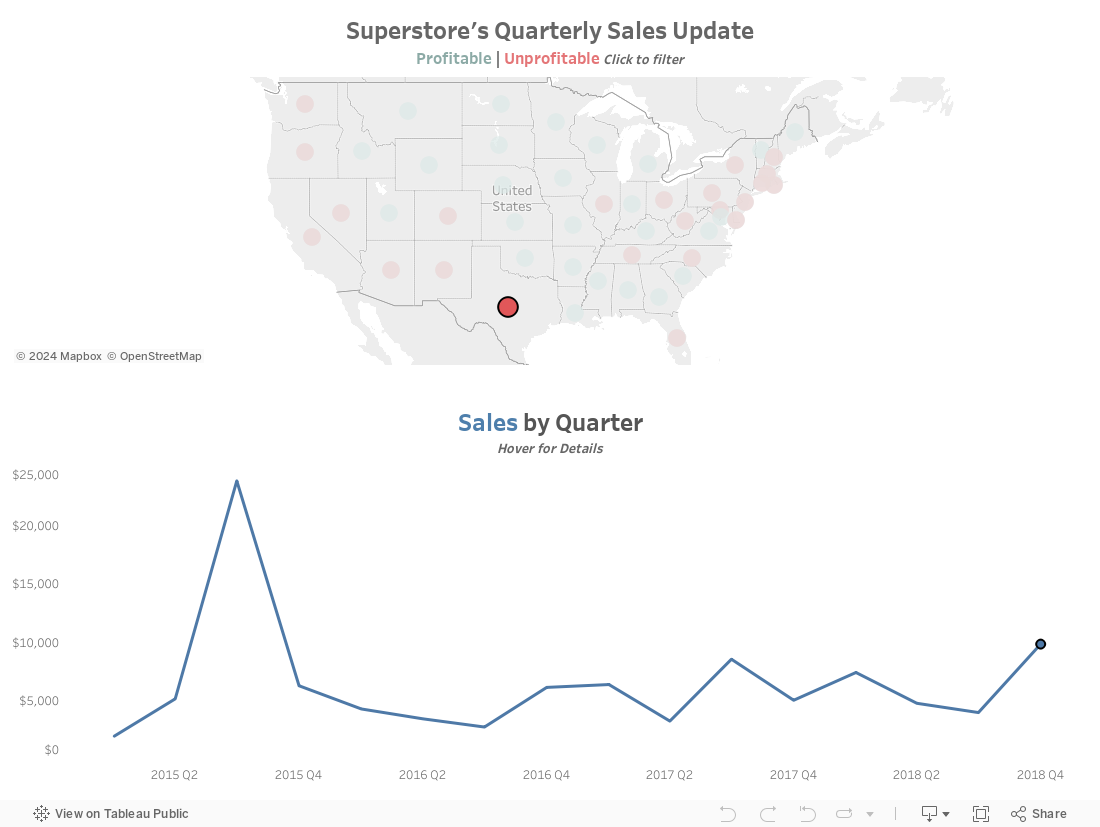
Hover over different points on the line and you will see data is still reflecting my total sales number. Luckily, we can resolve this issue with some creative filtering.
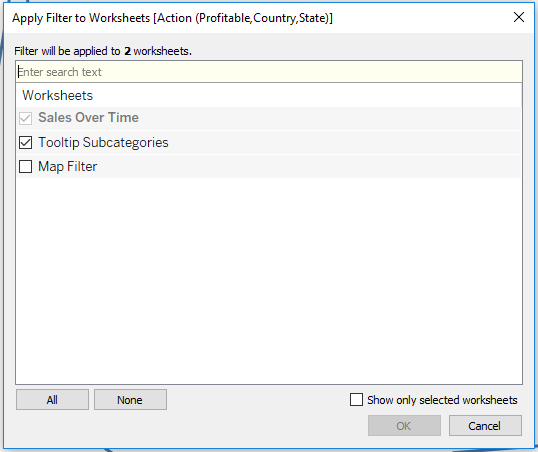
Update the Dashboard Action Filter
Our first step in making my filter apply to the tooltip viz is to edit our dashboard action filter. It is imperative that the dashboard action is targeting the sheet directly, not the sheet’s location on our dashboard:
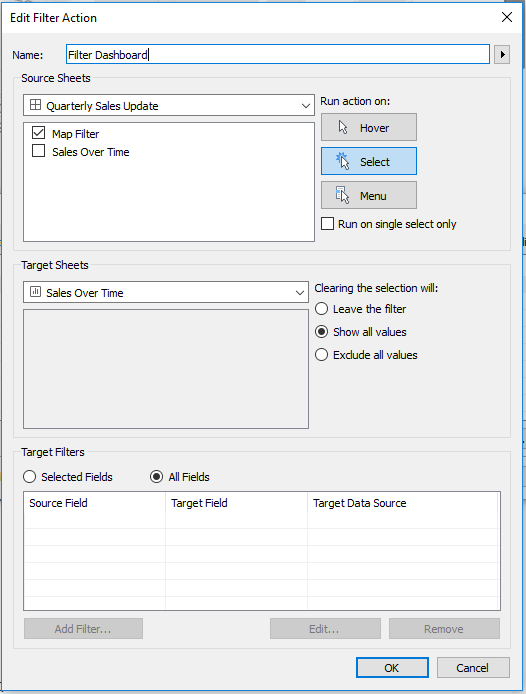
***Notice the Target Sheet is Sales Over Time, NOT a selection of Sales Over Time on the Quarterly Sales Update Dashboard.***
Apply the Filter to the Tooltip
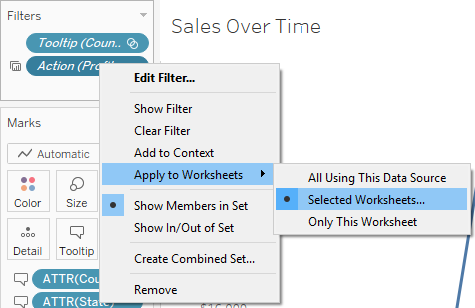
Now that I have changed my dashboard action to reference my sheet directly, that filter can now be edited at the sheet level. Since my tooltip sheet must take cues from its master, this allows me to edit the filter’s settings to apply it to my tooltip. To do this I will navigate to the Sales Over Time Sheet and select the action filter. After selecting the filter, I will have the option to Apply to Worksheets. From there, I can select the sheets I want the filter to affect (here that is my Sales Over Time line chart and my Tooltip Subcategories bar chart):
BOOM – Finito
Now that I have manipulated my dashboard action to affect the tooltip, my worksheet now references the correct data and presents my user with a detailed level of information regarding their sales. Hover across the line below to find out the details:
Now that you are a master of the tooltip viz, let me know how you implement it in your dashboards! If you want to get some hands-on practice messing with the filters, download the dashboard I made below.