Tableau Class Notes: To Aggregate or Not to Aggregate?
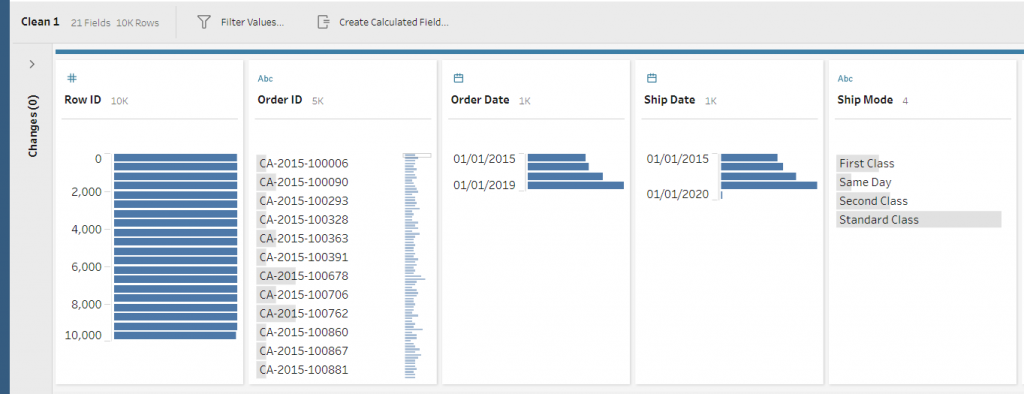
Since I have started using Tableau Prep, I can’t overstate how helpful it has been for cleaning, shaping and exploring my data before I start visualizing it in Tableau Desktop. However, one concept eluded me at first, and that was the Aggregate step. Why add an aggregate step if we can visualize our data at […]
The Importance of Diversity in Tech

Every December, the whole InterWorks family gathers in Stillwater, Oklahoma, for a company Summit. Each year, it offers a chance to catch up with friends, meet new ones and strategize about the next year. It’s a great time, filled with friendly competition and valuable conversations around the technologies we’re using, lessons learned from trainings and projects, […]
Split and Pivot Your Data with Tableau Prep
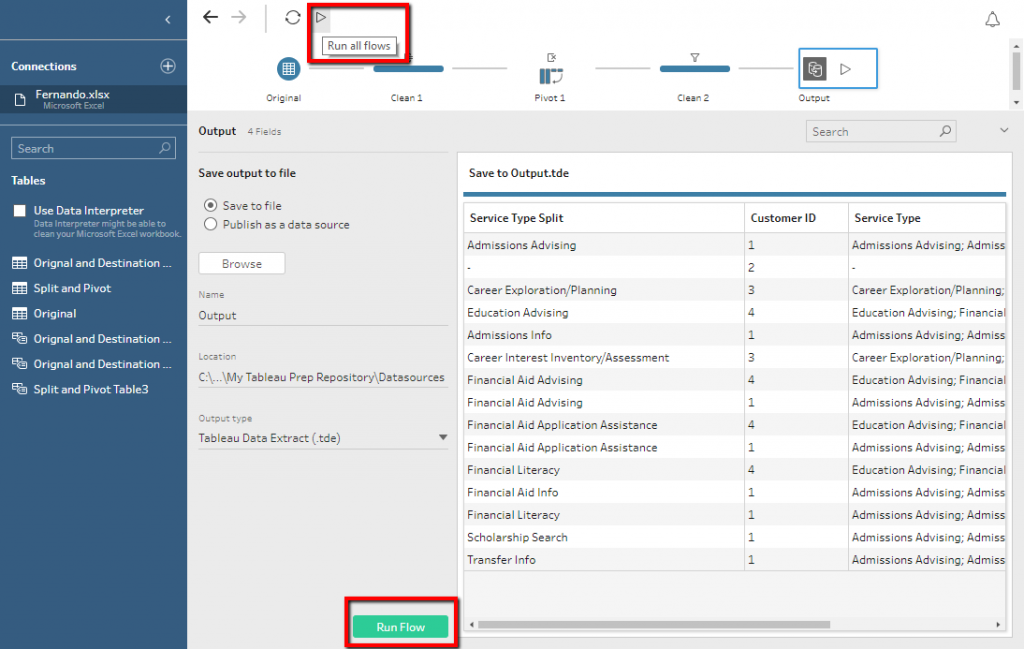
With the release of Tableau Prep in April 2018, analysts have been given an incredibly valuable tool for their analytical kit. Considering both performance and ease of use, prepping your data before it enters Tableau Desktop has many benefits. I’ve created the following walkthrough to demonstrate just one of many data prep scenarios our clients […]
InterWorks Quarterly Event Debrief: Q3-Q4 2018

It’s been very busy over here for the InterWorks Events team lately! Our third and fourth quarters of 2018 have seen some of our largest and most anticipated annual events, and we’re even more excited as we look ahead to what 2019 will bring. Here’s a debrief of some of the events we were able […]
Advance with Assist: Ungroup Column Headers That Have Concatenated
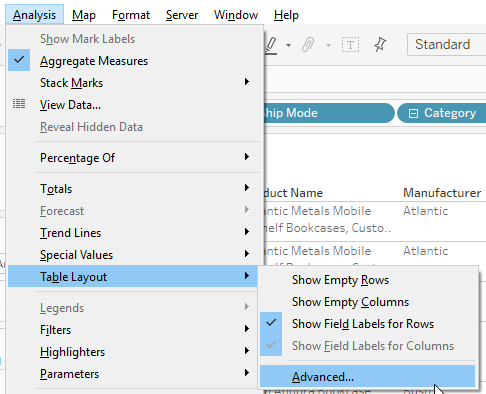
Question: I’m building a simple report for my manager. As I add new fields into the report, the first few dimensions that I’ve added are grouping together into a single column. They are separated by commas. I’ve tried adding width to the screen, but that doesn’t help. What have I done? Using Sample Superstore data, […]
WEBINAR: Why 2018 Is the Year of Embedded Analytics

When it came to the best solution for integrating Tableau dashboards in 2018, embedded analytics dominated. Once you’ve created the perfect dashboard and it’s been published to Tableau Server, driving traffic to it can be a challenge … but not with embedded analytics. In this webinar, analytics consultant Mark Bingham and Integration Practice Lead Derrick […]
Finding the Elusive Underlying Moving Average
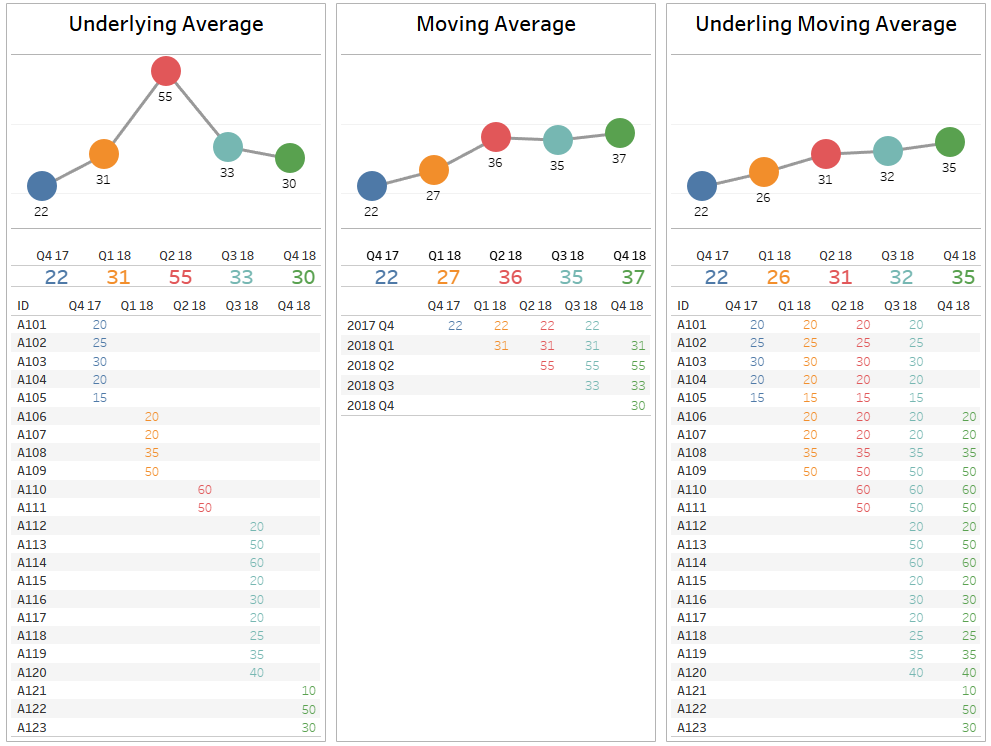
Table calculations enable you to do amazing things in Tableau. However, these work off of data that has already been aggregated. For example, a moving average is the moving average of the sum of some metric for each period. What if we needed a way to find the moving average of the underlying values instead? […]
Explore Your Personality Type in Tableau
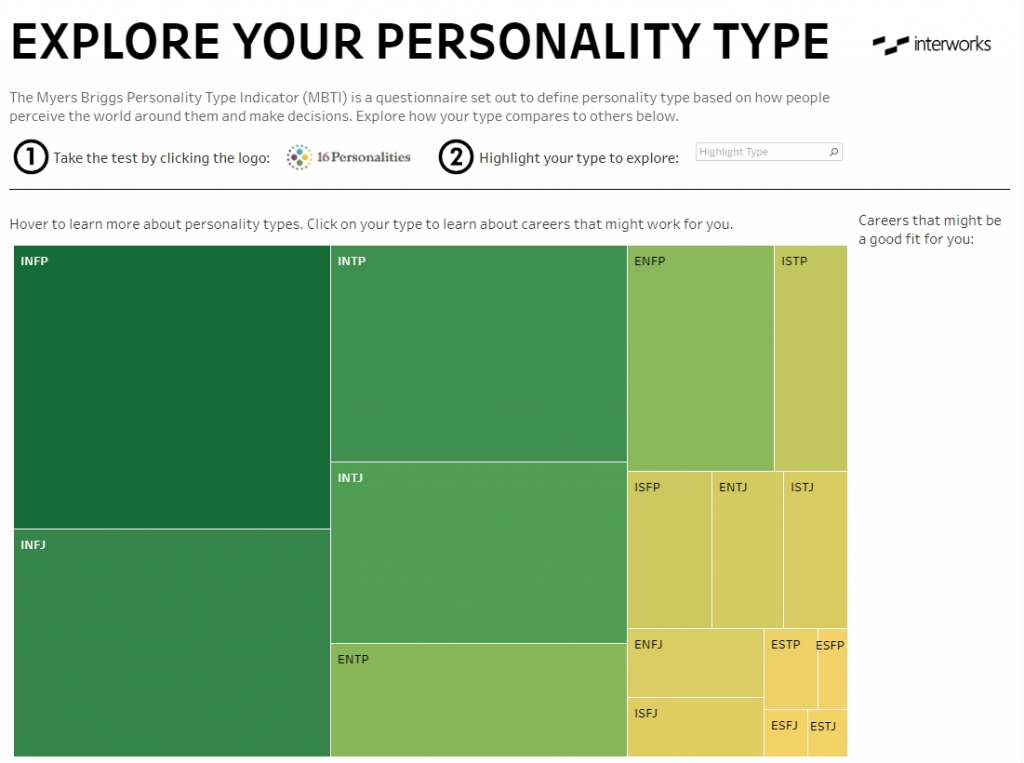
I have always been interested in personality types. They are helpful in giving clues into how people think and behave. So, I wanted to build a dashboard to allow people to explore how they compare to others who have taken the Myers Briggs Personality Test. Then, I wanted to take it a step further and […]
A Quick and Easy Way to Get Active Directory Counts
When investigating an existing domain for a potential upgrade or clean-up, it’s necessary to gauge the number of Active Directory (AD) objects in order to decide how many domain controllers are needed. This is also just useful information to occasionally check in order to keep track of your AD growth percentage. How to Check Your […]
Advance with Assist: Sorting with MONTH in Reverse
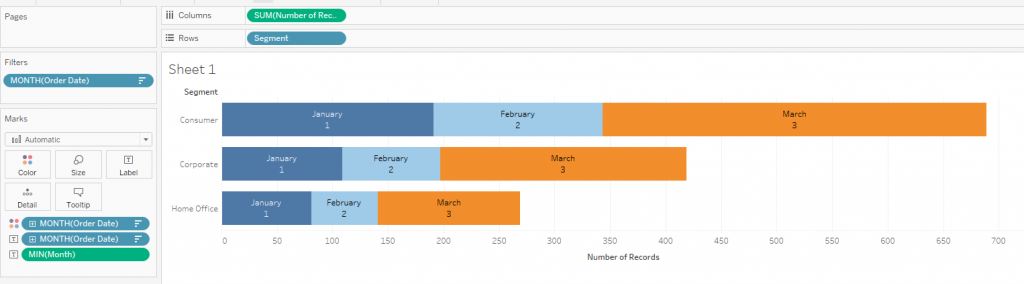
Question: I thought this would be easy and just a check somewhere, but I can’t figure out how to reverse the order of the colors. As new months are added, they go to the left. I want them on the right. What is the magic sauce? Well, this person was right—it is just a button […]
