Analytics Explained: Understanding Our World
So far in this series, we’ve laid a foundation for the analytics conversation, and we’ve discussed descriptive, or type 2, analytics. Now, we’re going to dive deeper into how we can apply this in more advanced contexts. The second type of analytics is all about building upon our descriptions of the world by looking for […]
Changes in Licensing and Site Roles When Upgrading Tableau Server
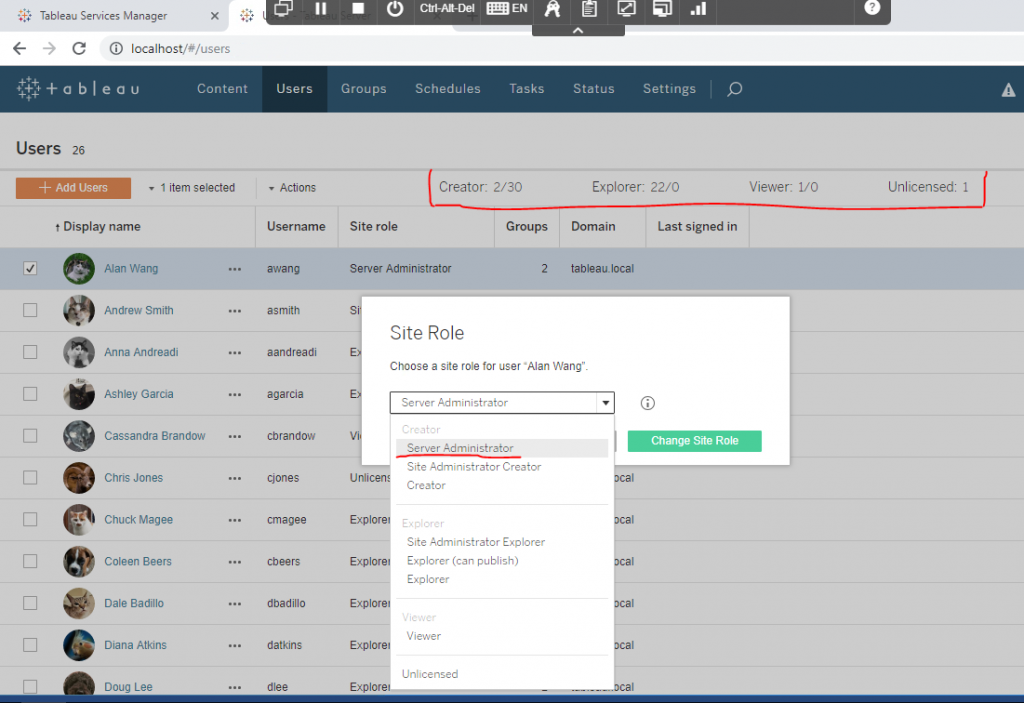
It can be a challenge to know exactly what happens in regard to Tableau Server licensing and site roles when you plan to upgrade, especially from a pre-2018.1 version. Here, I tested all potential site roles from upgrading Tableau Server 10.5 to 2018.3. Starting with a clean install of Tableau Server 10.5 with user-based licensing, […]
Creating Customized Legends in Tableau
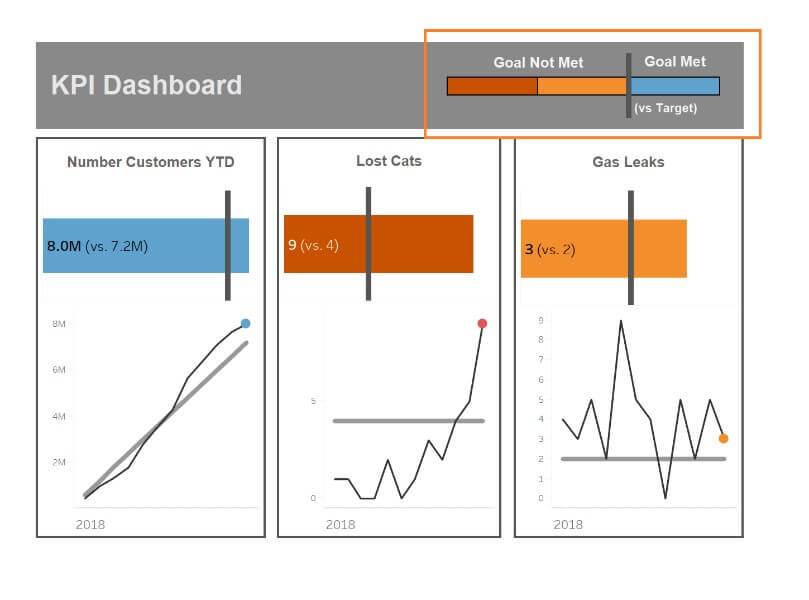
Create a legend. Show a legend. Be a legend. Tableau developers love a succinct workaround, especially when that workaround is more flexible, more intuitive and just as robust as the out-of-the-box functionality. As a Tableau trainer, I get asked a lot of questions about legends and quick filters, mainly around limitations in their behaviour. “Can […]
Offerings from the Tableau Bar Chart Menu
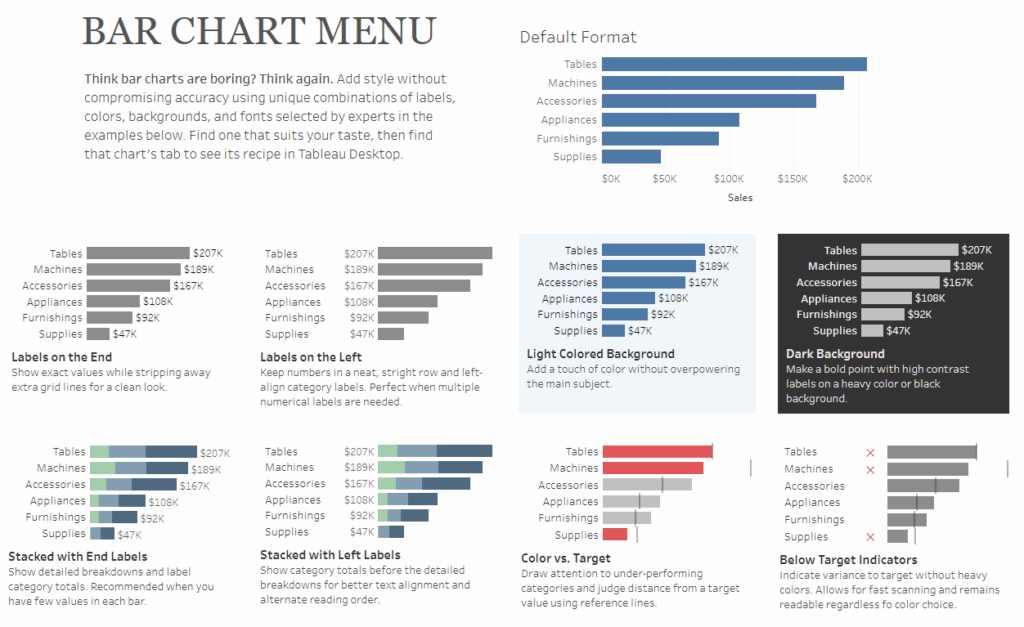
Note: As I was working on this dashboard, Jeff Schaffer posted a very similar idea. Visit this page for his perspectives and variations on this theme. When you need to decide what chart type is best for your data, there are many great tools to choose from. The Financial Times Visual Vocabulary and Tableau’s “Show […]
How I Went from Sales Support to Practice Lead

I never imagined I would one day become an analytics consultant. With the benefit of hindsight, I know it was a great career choice for me but one made more through luck and opportunity than design. So, I’m writing this blog as a piece of advice to my younger self and anybody else interested to […]
PYD76 – Year in Review and Preview

2018 was a big year for data but can 2019 be even bigger? Ben, Robert and Michael look back at the year that was and what they are looking forward to the most. Could 2019 be the year for [insert your favorite data-driven technology]? Take a listen to find out.
Advance with Assist: Saving User-Selected Filters on Tableau Server
Question: Our users are finding themselves clicking the same filters when they log onto dashboards they have access to. They are curious if there is a way for us to isolate the data for them only. How can we accomplish this without changing our data model extensively? Upon first reading, this issue could quickly have […]
How I Went from College Track Runner to Wedding Photographer to Marketing Generalist

I never say no. I get bored easily. I’m an adrenaline junkie. My closet is a mess. And I’ve only finished about four books in my entire life. When I was young, I wanted to do whatever sounded exciting that day. I imagined becoming everything from a surgeon to a news anchor when I got […]
Spotify Wrapped: InterWorks’ 2018 in Music
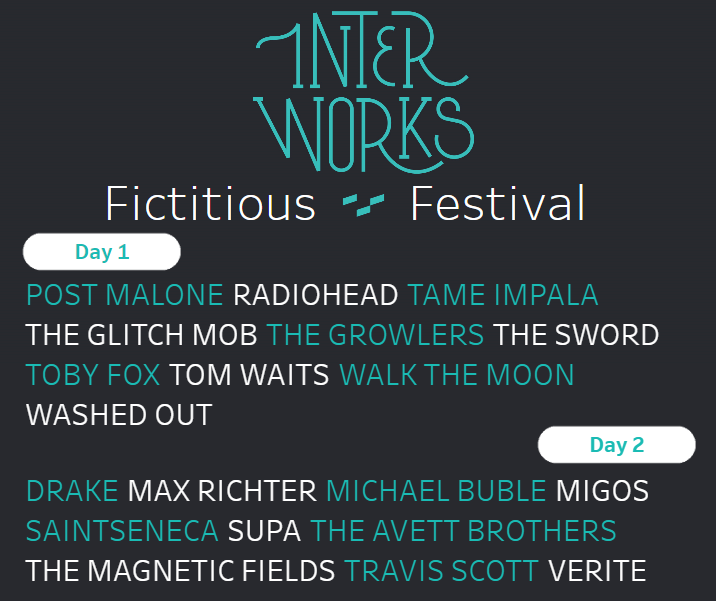
If you’re subscribed to a music-streaming service, chances are high that you use Spotify. And if you use Spotify, you probably received a Spotify Wrapped summary of your listening habits for 2018. This summary really consists of two parts: a visual slideshow that gives you a thorough retrospective of your year in music, including everything […]
Analytics Explained: Describing Our World
Descriptive analytics is all about answering simple questions like: How much did we sell last week? Which customers bought the most from us? How much inventory do we have left? It would be wrong, however, to think that answering these simple questions is itself simple. The temptation is to view this type of analytics as […]