2018 Tableau Fantasy Football Draft Kit

It’s August again, which means it’s still hot, but football is here! Personally, I’ve been enjoying a ton of baseball and the gobsmackload of home runs we’re seeing. The World Cup was also simply outstanding start to finish, but football in America means only one thing: 22 warriors on the gridiron. Expectations are high for a […]
Need a Car? Welcome to the InterWorks Dealership!

I love cars. The way they sound, the way the smell and the way they feel when you’re cruising down long roads. But sometimes, finding the right car for the experience can be troublesome. Car shopping is a lot like dating. There is a lot of fish in the sea, but when you find the […]
PYD64 – Sarah Burnett

Sarah Burnett’s career in data has taken her all over the world – from New Zealand to London and now to Singapore. Sarah co-leads the Singapore Tableau User Group (with Datasaurus Rex) and is a Tableau Social Ambassador. Jia returns to talk with Sarah about her data (and literal) travels, her involvement in the data community […]
Building Filters in Alteryx for Tableau, Part 1
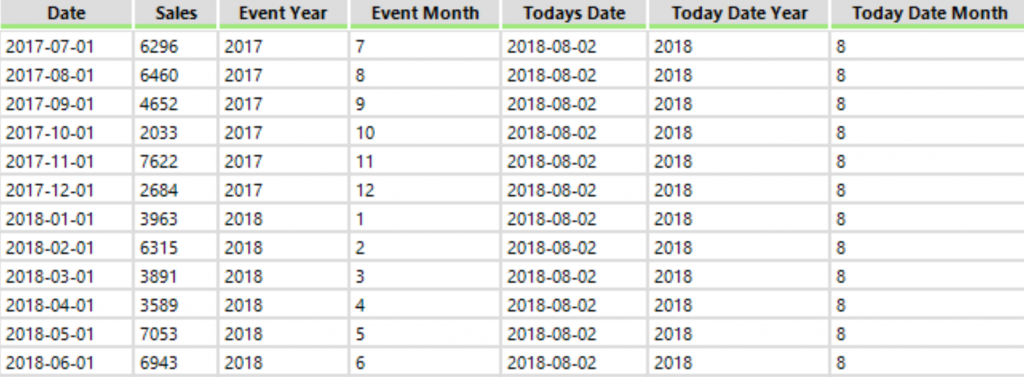
Recently, I was required to prepare data in Alteryx and output it into a .Hyper file to create a Tableau workbook. The data that was being utilised looked at past sales and potential future sales. The dataset was a very large dataset, over 20 million rows long and 100 columns wide. Once the workbook was […]
Portals for Tableau New Feature Spotlight: Export CSV Feature

Until now in Portals for Tableau, we’ve basically forced you to allow your users to download a crosstab of each dashboard by using the Export CSV button. If you didn’t want to let your users access this button, the only solution was to hide it with custom CSS. After a few requests for this custom […]
A Quick Tip to Improve Line Chart Labels in Tableau
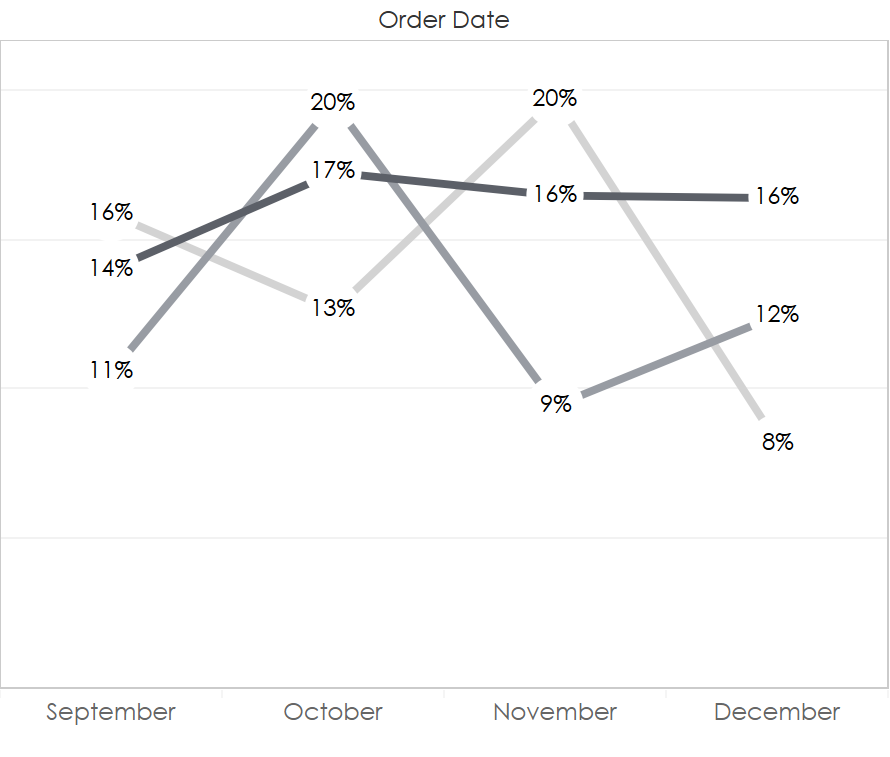
Labels on line charts can get messy. To reduce clutter, we are often are faced with reducing the labels to only the end of the line or simply removing the labels altogether. Here’s a simple trick that provides some flexibility with labels on lines. This quick method replaces the line vertices with the line labels, […]
Creating a Waterfall Chart in Tableau to Represent Parts of the Whole
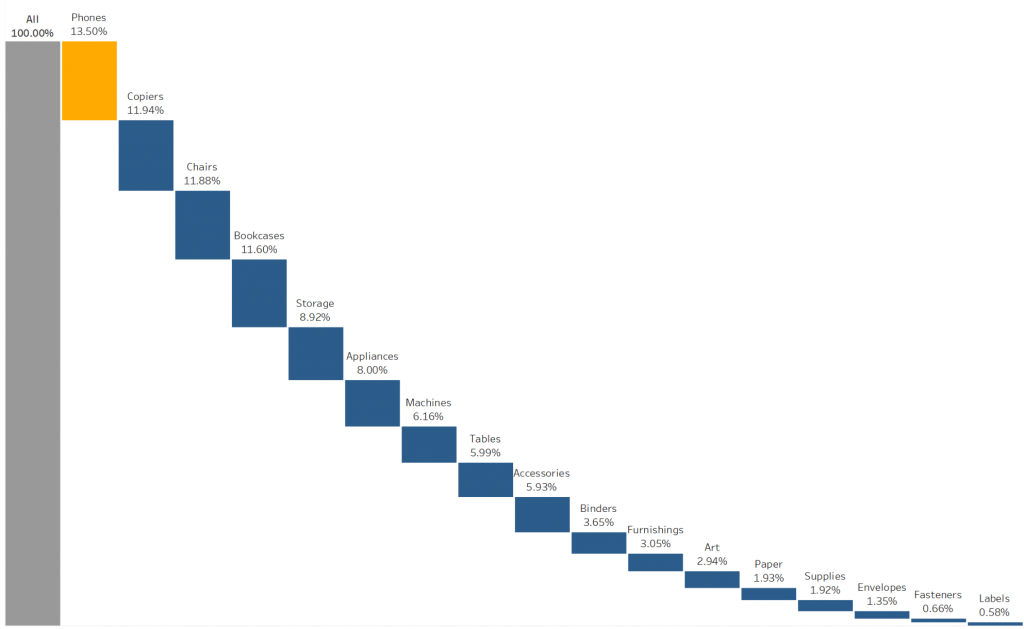
When we hear waterfall charts, we expect to see a visualization showcasing the cumulative effect across various categorical-based data to see the positive or negative change between them. But we have not talked about using a waterfall chart to represent parts of the whole. Pie charts, treemaps or stacked bar charts come to mind when […]
Advance with Assist: Creating a Sankey Diagram from Survey Data
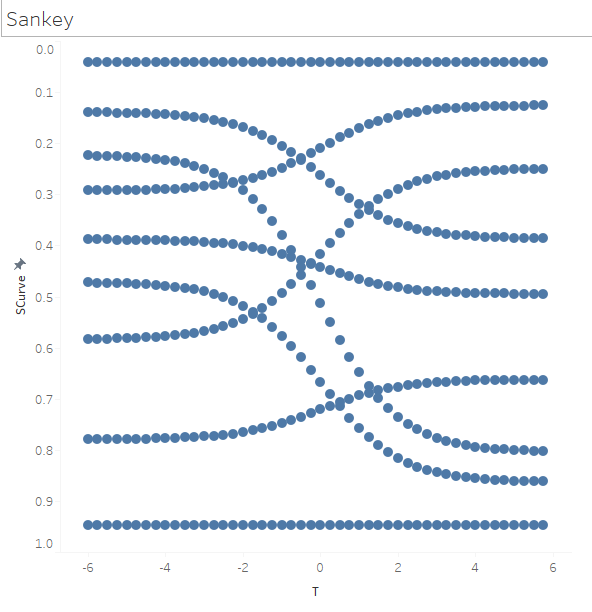
Question: “I want to build a Sankey diagram with my survey data, but I don’t know how to even start this. I want to be able to see someone’s response before exposure and after exposure to the test object we are surveying on. Could we hop on a working session and work through this process […]
Questions from Tableau Training: Down the Aggregation Rabbit Hole
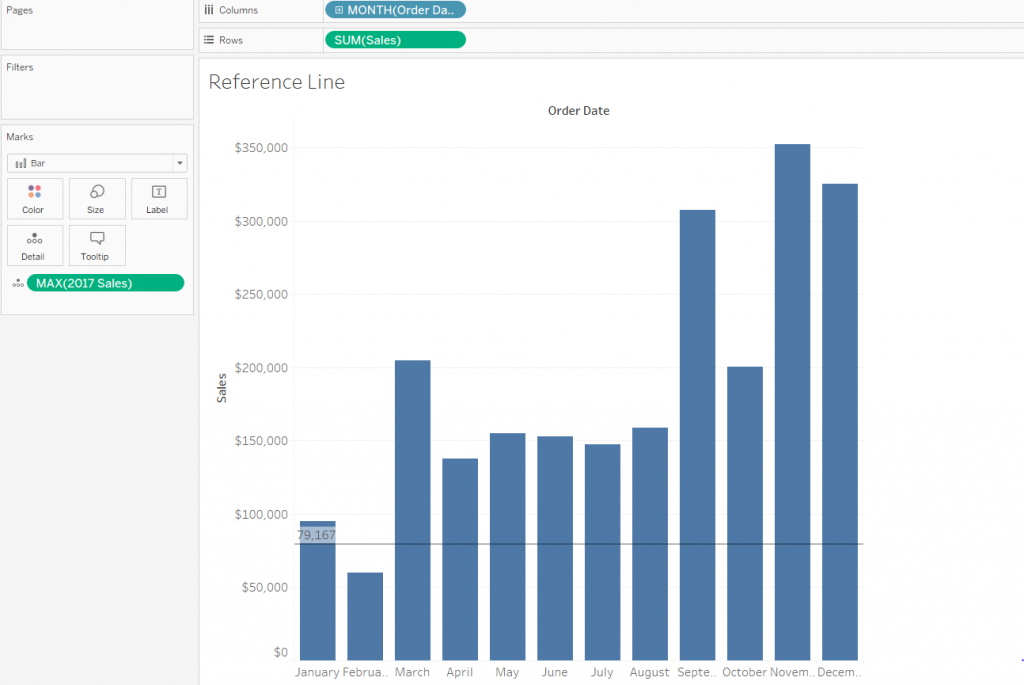
Every single day, I get emails from former students asking for help with everything from visual best practices to calculated fields. Sometimes the questions are quick while others require more thought. Some may be deceptively simple questions that turn into something more complicated than first thought. What started as a relatively straightforward question from a student […]
Portals for Tableau New Feature Spotlight: Quick Populate Tableau Server Connection

Portals for Tableau are created and maintained by lazy people. Many people that administer and use Portals for Tableau are also lazy people. This is not a bad thing. In fact, I would argue it’s dumb to do more work than is necessary. As a result, we like to build features that allow us to […]