Advance with Assist: Creating a Sankey Diagram from Survey Data

Data

Advance with Assist: Creating a Sankey Diagram from Survey Data

Advance with Assist shares quick solutions to common challenges encountered by the InterWorks Assist on-demand team.

Question:

“I want to build a Sankey diagram with my survey data, but I don’t know how to even start this. I want to be able to see someone’s response before exposure and after exposure to the test object we are surveying on. Could we hop on a working session and work through this process together?”

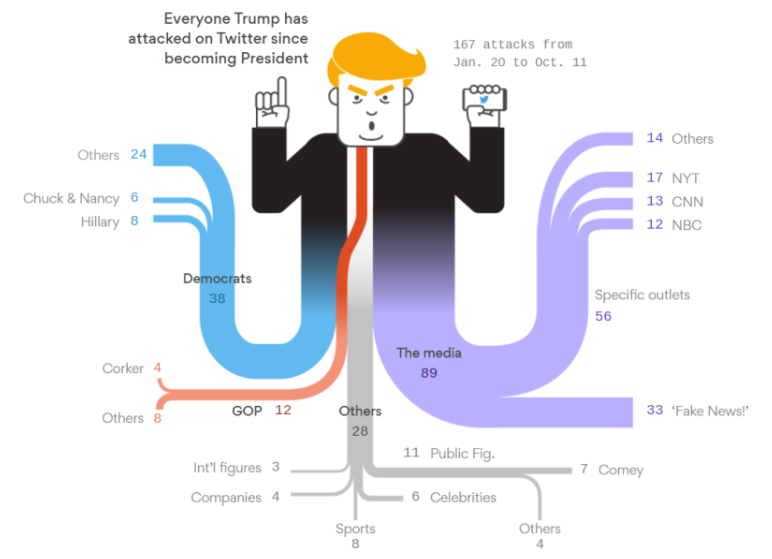
If you’ve never heard of a Sankey diagram, they are quite fun. Here’s an interpretation from datavizblog.com:

Sankey Diagram from DataVizBlog

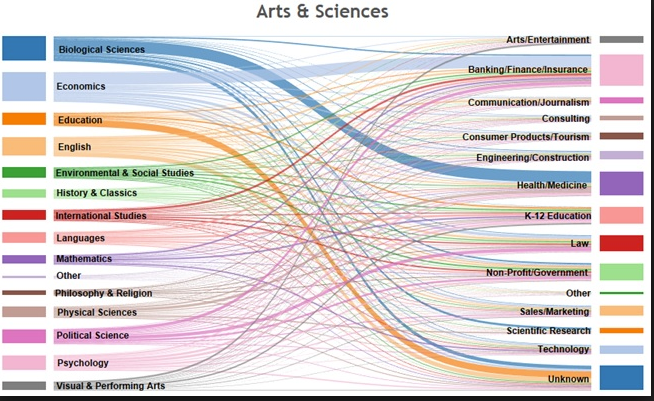
While there is a more standard use of the Sankey by Assoc. For Institutional Research:

Traditional Sankey

There are several steps to getting this right, and I’ve outlined them step by step below.

Overview

You need two dimensions that you will be connecting between. Next, you need a way to stretch the data between the two axes. In my example, I only have one point for pre-exposure answers and one for post-exposure answers on the survey. This would result in a straight line, not a curve. To get the curve, you need to use the Sigmoid function with your stretch field along with some table calculation magic. Enough overview – let’s just dive into the steps and see how this all comes together.

1. Data Setup

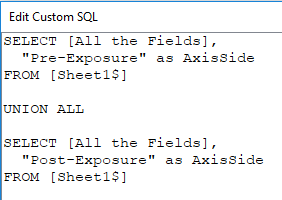
The first step involves structuring the data so that you have a flow between two dimensions. I only have a single record per respondent, and I need two records to connect in a Sankey. Many survey data sources group the data into one row by respondents – that way, when you look at that respondent in a spreadsheet, you can see their change. This doesn’t support a Tableau Sankey well, so we are going to restructure the data using a custom SQL union duplicating the same sheet. We’ll also place an axis side field for the left and right sides of the chart, as shown in this image:

SQL Union in Tableau

2. Padding

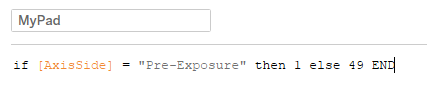
We only have two points of data now, but we need to add some data densification, a.k.a. padding, for all the data we don’t have between these two points. To do these, I start by creating a calculated field called MyPad:

MyPad Calculation

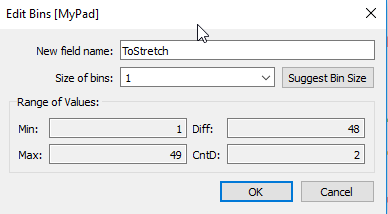
Now that we know which side is the left side, we can stretch to the data to the right using bins. Right-click the MyPad field and create bins of size 1. I named my field ToStretch:

Edit Bins in Tableau

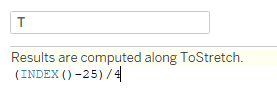
Let’s see this start to come together. Next, we create another calculation entitled T.  I also defaulted the table calculation to use ToStretch:

T Calculation

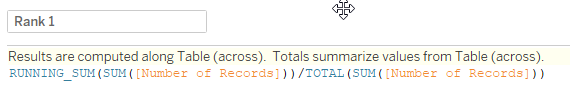
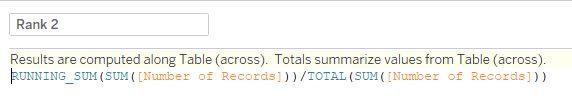
And the last calculations we need before creating the S-curve are the ranking calculations. These will keep our data points correct vertically when we build out the Sankey in a minute:

Rank 1 Calculation in Tableau

Rank 2 Calculation in Tableau

3. Creating the Curve

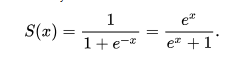
The mathematical function to create an S-curve is the Sigmoid:

Sigmoid

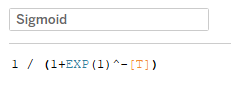
We can use Tableau to recreate this function to look like this:

Sigmoid Function in Tableau

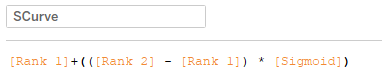
We then need to add in our ranking functions to get our curve field correct:
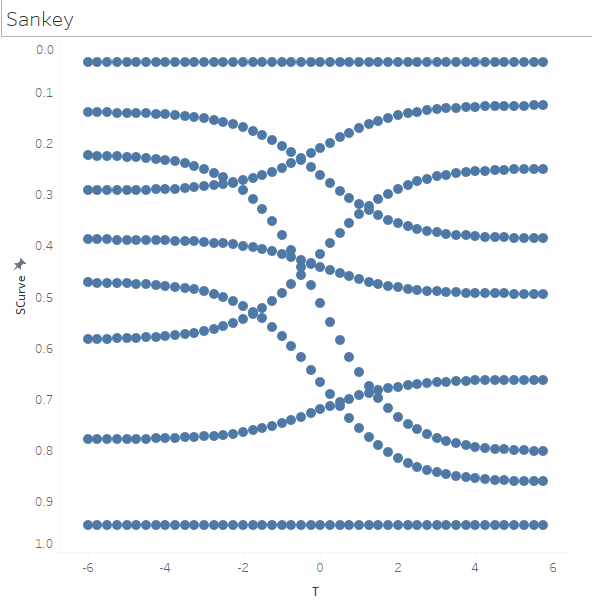
Add Ranking Function

4. Building the Viz

  1. Pull the two dimensions you are wanting to connect to the Detail shelf along with the ToStretch bin field.
  2. Change your Mark type to Circle.
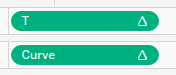
  3. Pull T to Columns and Curve to Rows. You’ll notice the Delta letting you know that we will need to update the table calculation to display the curve correctly.
    T to Columns, Curve to Rows
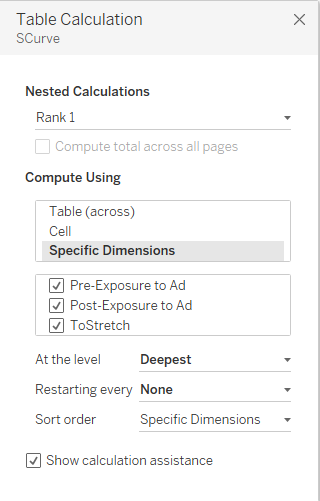
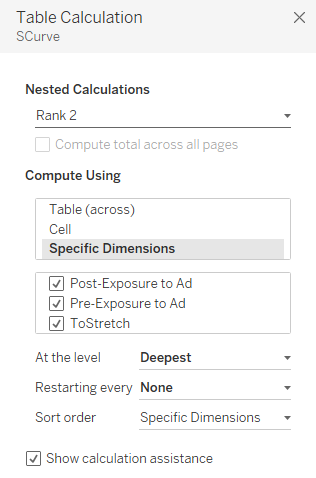
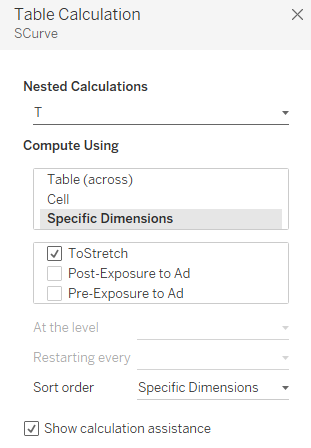
  4. Right-click on Curve pill and edit the nested calculations like so:
    • Rank 1 to be Specific Dimensions from Pre to Post to ToStretch, in that order.
    • Rank 2 to be Specific Dimensions from Post to Pre to ToStretch, in that order.
    • T to be Specific Dimensions for ToStretch only.


Nested Calc: Rank 1 Nested Calc: Rank 2 Nested Calc: T

I now have a Sankey chart that I can start to make formatting changes to. Make the Mark type a Line instead of circles, adding sizing to show how many respondents there are for each line. You might also create two additional charts for the left and right so you can see what the respondent answered pre vs. post-exposure.

Final Tableau Sankey

I hope you find this helpful. If you need help like this, reach out and get InterWorks Assist on your team.

Learn More

Want More Advance with Assist

  1. Advance with Assist: Filtering Select Dates with DATETRUNC
  2. Advance with Assist: Enhancing Dashboards with Custom Icons
  3. Advance with Assist: Tableau Power User Leaving the Company
  4. Advance with Assist: Context Filters and LOD Calculations
  5. Advance with Assist: Custom Subscriptions with Tableau Server Custom Views
  6. Advance with Assist: Blending with Dimension Not Utilized
  7. Advance with Assist: Creating a Sankey Diagram from Survey Data
  8. Advance with Assist: Multiple Dashboard Actions with a Single Click
  9. Advance with Assist: Refreshing Tableau Online Data with Tableau Bridge
  10. Advance with Assist: Parameter Performance Optimization
  11. Advance with Assist: Using Custom Backgrounds with Polygon Shapefiles
  12. Advance with Assist: Changing Default Properties on Data
  13. Advance with Assist: Options for Calculating Percentages
  14. Advance with Assist: Removing Options from Filter List
  15. Advance with Assist: Extracting Year from De-identified Text String
  16. Advance with Assist: Marking the Latest Date on Trend Line
  17. Advance with Assist: What You Need to Know About Aliases
  18. Advance with Assist: Function Compatibility
  19. Advance with Assist: Mass Parameter Replacement
  20. Advance with Assist: Sorting with MONTH in Reverse
  21. Advance with Assist: Ungroup Column Headers That Have Concatenated
  22. Advance with Assist: Connectionless Failure Error in Tableau Server
  23. Advance with Assist: How to Exceed Tableau’s Column or Row Limit
  24. Advance with Assist: Adding Email Links to Your Dashboard
  25. Advance with Assist: Saving User-Selected Filters on Tableau Server
  26. Advance with Assist: Tableau and Named Ranges in Excel
  27. Advance with Assist: Editing Custom Fields in Tableau-Published Data Sources
  28. Advance with Assist: NOW and TODAY Functions in Tableau
  29. Advance with Assist: Sheet Swapping with Dummy Headers
  30. Advance with Assist: REST Error in Tableau and Snowflake Connection
  31. Advance with Assist: Mapping with One Data Row in Tableau 2019.2
  32. Advance with Assist: Multi-Number Formats for Single Calculations
  33. Advance with Assist: Removing Background Landmass on a Tableau Map
  34. Advance with Assist: Filtering Data Sources on Tableau Server
  35. Advance with Assist: Swapping Sheets in Tableau 2019.2
  36. Advance with Assist: Filling in Null Records Without Filtering
  37. Advance with Assist: Nested IF Calculations in Tableau
  38. Advance with Assist: Getting Show/Hide Buttons to Appear in Tableau Desktop
  39. Advance with Assist: Alteryx Output Error
  40. Advance with Assist: Missing Joins in Tableau 2020.2
  41. Advance with Assist: Tableau Server – Interactive MicroService Container Degraded
  42. Advance with Assist: A Shortcut for Duplicating Calculations
  43. Advance with Assist: Tableau Server License Renewal Refresh 
  44. Advance with Assist: Encrypt Tabcmd Credentials
  45. Advance with Assist: Pointing Tableau to a Named Range
  46. Advance with Assist: Tableau Server Migrations
  47. Advance with Assist: Adding ALL Selection to Parameters
  48. Advance with Assist: Uncaught Type Error in Tableau Server
  49. Advance with Assist: Site Roles Changing on Tableau Server
  50. Advance with Assist: Highlighting Points of Interest
  51. Advance with Assist: Finding Max Date and More
  52. Advance with Assist: Adding Field Names Above Bars on a Bar Chart
  53. Advance with Assist: Using Map Layers with Unconnected Data Sources

More About the Author

Dustin Wyers

Support Lead, Americas
How Assist by InterWorks Supports Your Entire Data Stack Assist by InterWorks has been helping hundreds of InterWorks clients for years now. Assist got its beginnings as an on-demand, Tableau ...
Tableau Conference 2021: Devs on Stage in Review As always, the keynotes from the Tableau Conference, even virtually, are always an exciting highlight, and I love getting to write ...

See more from this author →

InterWorks uses cookies to allow us to better understand how the site is used. By continuing to use this site, you consent to this policy. Review Policy OK

×

Interworks GmbH
Ratinger Straße 9
40213 Düsseldorf
Germany
Geschäftsführer: Mel Stephenson

Kontaktaufnahme: markus@interworks.eu
Telefon: +49 (0)211 5408 5301

Amtsgericht Düsseldorf HRB 79752
UstldNr: DE 313 353 072

×

Love our blog? You should see our emails. Sign up for our newsletter!