Advance with Assist: Highlighting Points of Interest

Data

Advance with Assist: Highlighting Points of Interest

Advance with Assist shares quick solutions to common challenges encountered by the InterWorks Assist on-demand team.

Question: I want to allow my user to easily see a custom value that is connected to a highlighted point on my time series chart. How can I do this in a way that can also interact with a dashboard action to give these values more prominence and context for the user?

Client Scenario

You have a time-series chart that shows a metric over time, and you want your user to be able to select a custom point of interest (POI) and be able to show the value that is highlighted prominently. For example, imagine we want a user to be able to view sales for a given month in the past and have a separate scorecard dedicated to that POI. What we want can be seen below:

Here’s what we currently have:

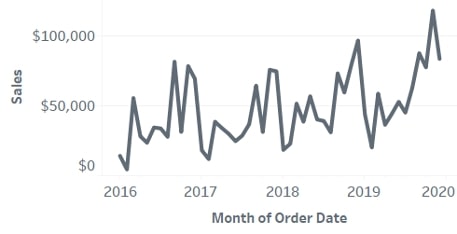
Here’s what we need:

  1. A parameter for the point of reference
  2. A highlight action for the reference line
  3. Three calculated fields
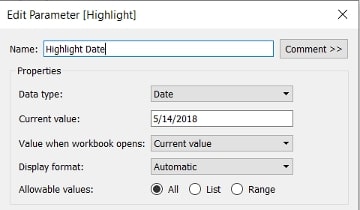
The Parameter

The highlight date is what will be placed on the chart and defined by the user as a point of interest:

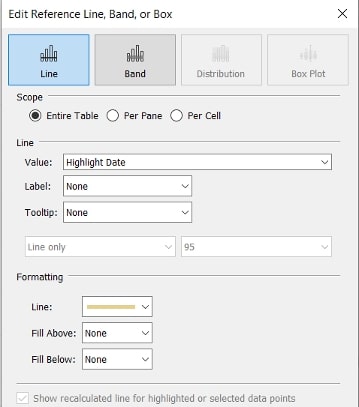
The Reference Line for Context 

This reference line will use the Highlight Date parameter:

Calculated Fields in Tableau

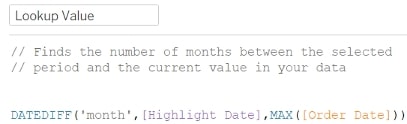
Lookup Value: The number of periods (months) between your reference point and your current period, or the end of your dataset:

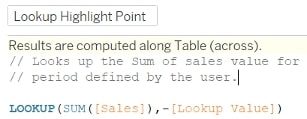
Lookup Highlight Point: The number of periods (months) between your reference point and your current period, or the end of your dataset:

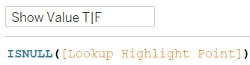
Show Value T|F: A Boolean field that will allow you to show the current lookup value on a separate sheet:

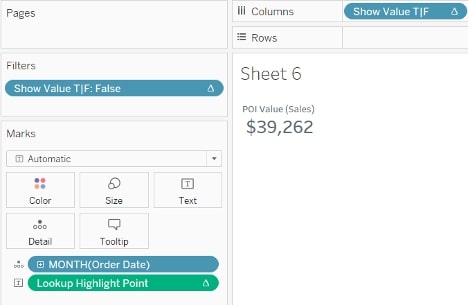
Set up the Context Scorecard

Here are the steps for setting up your scorecard:

  1. Create a new sheet
  2. Add Lookup Highlight Point to the Marks card as Text and compute using Cell
  3. Add your date field to Detail (MONTH, in this case)
  4. Add Show Value T|F to the Columns shelf and compute using Cell
  5. Filter Show Value T|F to show False only
  6. Uncheck Show Header on Show Value T|F

Voila! Your context scorecard is ready. Now, bring this onto your dashboard. With this approach, you could also do comparisons to other periods of interest or the current period:

I hope you find this helpful! If you need help like this, reach out and get InterWorks Assist on your team!

Want More Advance with Assist

  1. Advance with Assist: Filtering Select Dates with DATETRUNC
  2. Advance with Assist: Enhancing Dashboards with Custom Icons
  3. Advance with Assist: Tableau Power User Leaving the Company
  4. Advance with Assist: Context Filters and LOD Calculations
  5. Advance with Assist: Custom Subscriptions with Tableau Server Custom Views
  6. Advance with Assist: Blending with Dimension Not Utilized
  7. Advance with Assist: Creating a Sankey Diagram from Survey Data
  8. Advance with Assist: Multiple Dashboard Actions with a Single Click
  9. Advance with Assist: Refreshing Tableau Online Data with Tableau Bridge
  10. Advance with Assist: Parameter Performance Optimization
  11. Advance with Assist: Using Custom Backgrounds with Polygon Shapefiles
  12. Advance with Assist: Changing Default Properties on Data
  13. Advance with Assist: Options for Calculating Percentages
  14. Advance with Assist: Removing Options from Filter List
  15. Advance with Assist: Extracting Year from De-identified Text String
  16. Advance with Assist: Marking the Latest Date on Trend Line
  17. Advance with Assist: What You Need to Know About Aliases
  18. Advance with Assist: Function Compatibility
  19. Advance with Assist: Mass Parameter Replacement
  20. Advance with Assist: Sorting with MONTH in Reverse
  21. Advance with Assist: Ungroup Column Headers That Have Concatenated
  22. Advance with Assist: Connectionless Failure Error in Tableau Server
  23. Advance with Assist: How to Exceed Tableau’s Column or Row Limit
  24. Advance with Assist: Adding Email Links to Your Dashboard
  25. Advance with Assist: Saving User-Selected Filters on Tableau Server
  26. Advance with Assist: Tableau and Named Ranges in Excel
  27. Advance with Assist: Editing Custom Fields in Tableau-Published Data Sources
  28. Advance with Assist: NOW and TODAY Functions in Tableau
  29. Advance with Assist: Sheet Swapping with Dummy Headers
  30. Advance with Assist: REST Error in Tableau and Snowflake Connection
  31. Advance with Assist: Mapping with One Data Row in Tableau 2019.2
  32. Advance with Assist: Multi-Number Formats for Single Calculations
  33. Advance with Assist: Removing Background Landmass on a Tableau Map
  34. Advance with Assist: Filtering Data Sources on Tableau Server
  35. Advance with Assist: Swapping Sheets in Tableau 2019.2
  36. Advance with Assist: Filling in Null Records Without Filtering
  37. Advance with Assist: Nested IF Calculations in Tableau
  38. Advance with Assist: Getting Show/Hide Buttons to Appear in Tableau Desktop
  39. Advance with Assist: Alteryx Output Error
  40. Advance with Assist: Missing Joins in Tableau 2020.2
  41. Advance with Assist: Tableau Server – Interactive MicroService Container Degraded
  42. Advance with Assist: A Shortcut for Duplicating Calculations
  43. Advance with Assist: Tableau Server License Renewal Refresh 
  44. Advance with Assist: Encrypt Tabcmd Credentials
  45. Advance with Assist: Pointing Tableau to a Named Range
  46. Advance with Assist: Tableau Server Migrations
  47. Advance with Assist: Adding ALL Selection to Parameters
  48. Advance with Assist: Uncaught Type Error in Tableau Server
  49. Advance with Assist: Site Roles Changing on Tableau Server
  50. Advance with Assist: Highlighting Points of Interest
  51. Advance with Assist: Finding Max Date and More
  52. Advance with Assist: Adding Field Names Above Bars on a Bar Chart
  53. Advance with Assist: Using Map Layers with Unconnected Data Sources

More About the Author

Jack Hulbert

Analytics Architect
ThoughtSpot 101: Row-Level Security In this blog, we’re going to cover some fundamentals for a successful Row-Level Security (RLS) implementation in ThoughtSpot. What is ...
ThoughtSpot 101: 5 Tips for Creating Really Good Liveboards In our last blog, we gave you some tips on how to create worksheets that will bring your users a delightful search analytics ...

See more from this author →

InterWorks uses cookies to allow us to better understand how the site is used. By continuing to use this site, you consent to this policy. Review Policy OK

×

Interworks GmbH
Ratinger Straße 9
40213 Düsseldorf
Germany
Geschäftsführer: Mel Stephenson

Kontaktaufnahme: markus@interworks.eu
Telefon: +49 (0)211 5408 5301

Amtsgericht Düsseldorf HRB 79752
UstldNr: DE 313 353 072

×

Love our blog? You should see our emails. Sign up for our newsletter!