Ottawa: Capital city to our neighbor to the north, Canada. Home to astronauts, comedians, musicians and more. The University of Ottawa educated the greatest game show host of all time, Alex Trebek, who studied philosophy (presumably because he couldn’t major in trivia). But most exciting of all, Ottawa is home to an excellent open data catalogue. Full of information on contracts, budgets, population elections, you name it. Alright, it’s maybe not the most exciting thing about Ottawa, but it’s definitely exciting to a data dweeb like me.
After browsing the Ottawa Data Catalogue, I found some awesome datasets on sports fields, skateparks, beaches and other recreational facilities. I thought, “What if I l used a list of all their recreational facilities and made a viz out of that!” So, I started looking for the compiled list of all their recreational facilities. Then I hit the bottom of the catalogue. No big, clean, fun list of Ottawa’s play structures, skating rinks and tennis courts. Just 14 different sets for 14 different types of parks.
Fortunately, I had both the tools and the knowledge to blend these data sets and visualize the results. You can keep reading to learn about the process or you can jump directly to the viz.
Enter Alteryx
Thanks to Alteryx, I was able to take these 14 different data sets, with varying amounts of detail and information, to make one, clean, analyzable dataset. Here’s how:
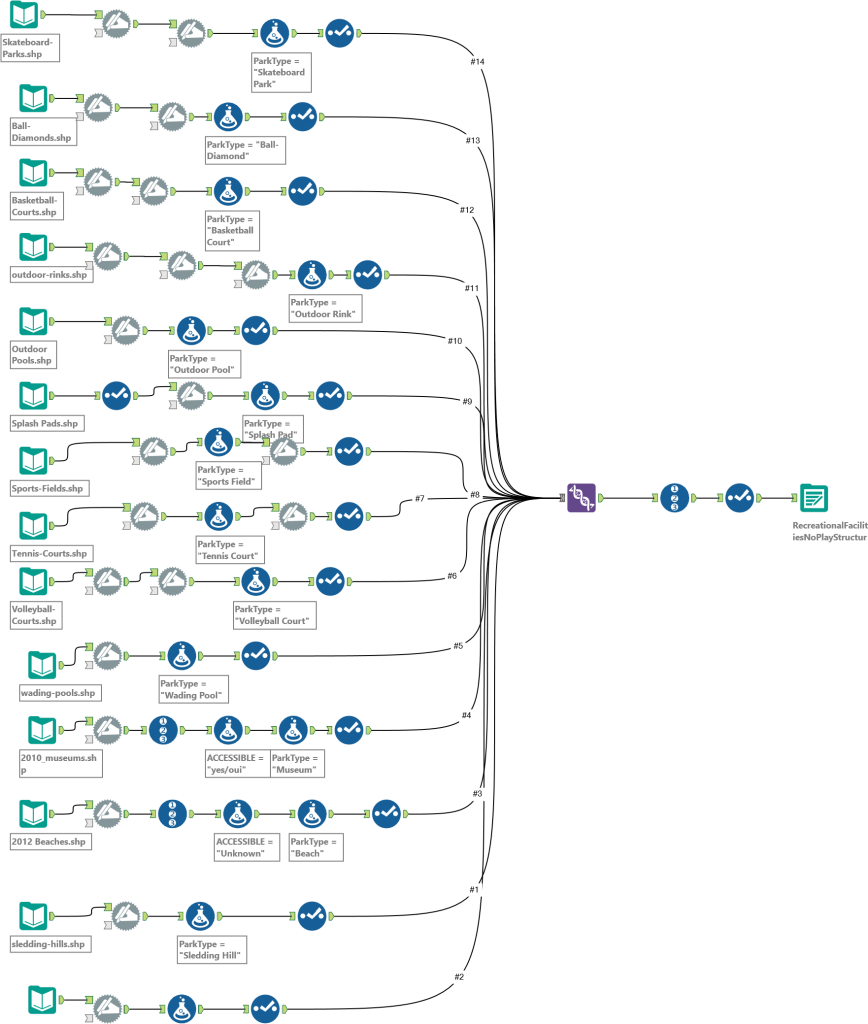
Step 1: Load all 14 .shp files.
Step 2: Create a PARKTYPE Field. This adds another field naming the type of park it was based on the file it came from. This helped me distinguish the basketball court from the sledding hill from the skating rinks and so on.
Step 3: Rename the main descriptor for each field. Instead of having different fields for COURT_TYPE,” “FIELD_TYPE or RINK_TYPE, I decided to create one common column called FACILITY_TYPE.
Step 4: Rename the name field. This was to remediate the issue caused by different naming conventions from the different files. Ball-Diamonds used FIELDNAME while Splash Pads were labeled by PARKNAME, and others just used NAME. All to describe the same thing. So, I created a unique NAMEID field, so that when creating the union between these tables, they would stack into one consistent field.
Step 5: Select the only necessary fields. There were multiple fields that only applied to one specific file and wouldn’t be useful for a final set, such as LINK_DESCRIPTION, CLASS or POST_TYPE. Canada is also cool and bilingual, so it had a French copy of every field. Sadly, I don’t speak French, so I nixed these.
Step 6: Union. Union. Union. And, you guessed it, Union. 14 total unions were needed to combine the data into one, long table. Luckily, you don’t need a union action for each instance and can combine them all using a single union node. Just drag and drop.
Step 7: Add a Unique Identifier. While PARKID and FACILITYID were present for most fields, they often overlapped. Parks had multiple facilities, and the FACILITYID was not unique across parks. To guarantee that there was a unique identifier for each row of the data, I used the Row ID Tool. I called my new field: UNIQUE_ID. Clever, I know.
Step 8: (Optional) One last select statement. This is to make sure no unwanted fields slipped through the cracks, and I only had the data I wanted.
Step 9: Output data as a .shp file. I chose the .shp to keep the spatial object that would allow it to work in a Tableau map.
Step 10: Lean back, crack my fingers and hit Run.
But GHASP!
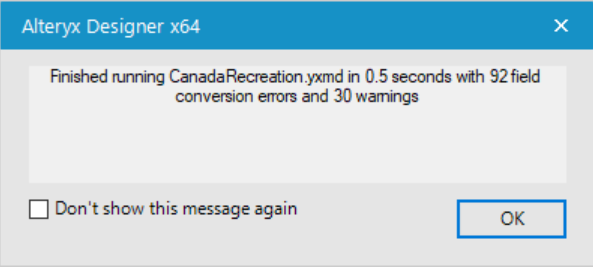
That’s a lot of warnings! But worry not, there is a simple explanation. The field conversions errors occurred due to the Created_D and Modified_D fields. These were blank date fields that were recorded as “ – – “ which is not a valid date, so we received an error notice. These fields were also not included in the final dataset, so no harm, no foul!
The warnings were not the doom of the project either. They simply let me know that there were some missing values in certain fields (i.e., some of the values for the links field were missing, perhaps because there is no website for Ottawa Lawn bowling … yet). Unfortunately, Alteryx does not allow you to make data appear where none exists.
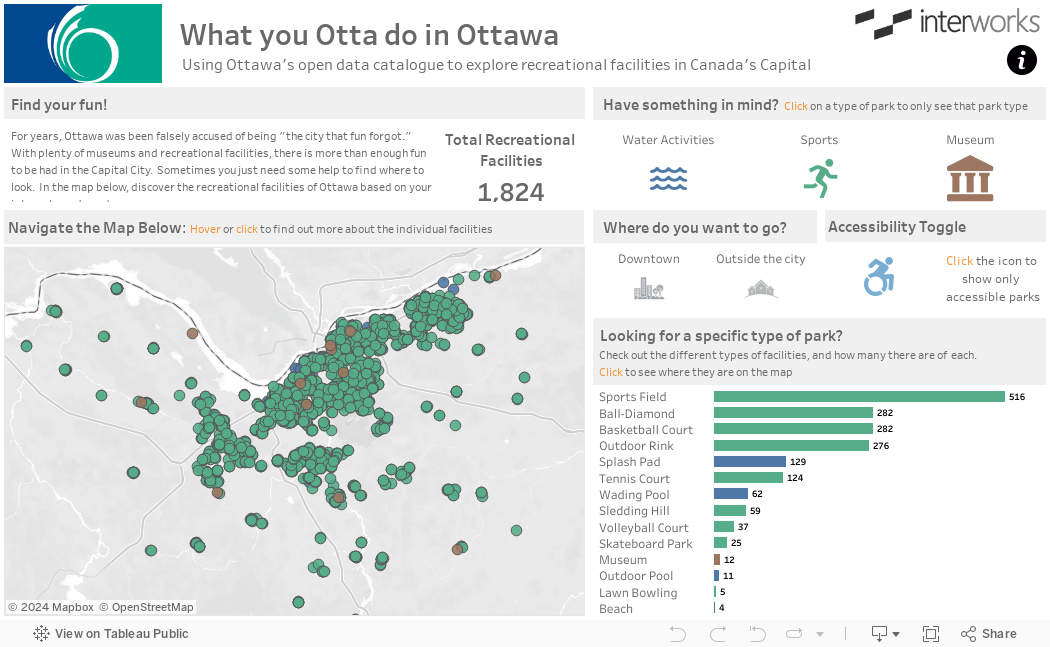
And “voila!” Now with a ready data set, I began to explore the various activities for a day out (or a day “oot”) in lovely Ottawa. Take a look!
Show a little love to our neighbors to the north (and in case the whole North Korea thing doesn’t pan out). Take a look into some cities. Ottawa ranked one of the best place to live in Canada, as documented here and here.
Appendix
Screenshot of Alteryx workflow: