Tableau Server on Linux: Performance Sneak Peek
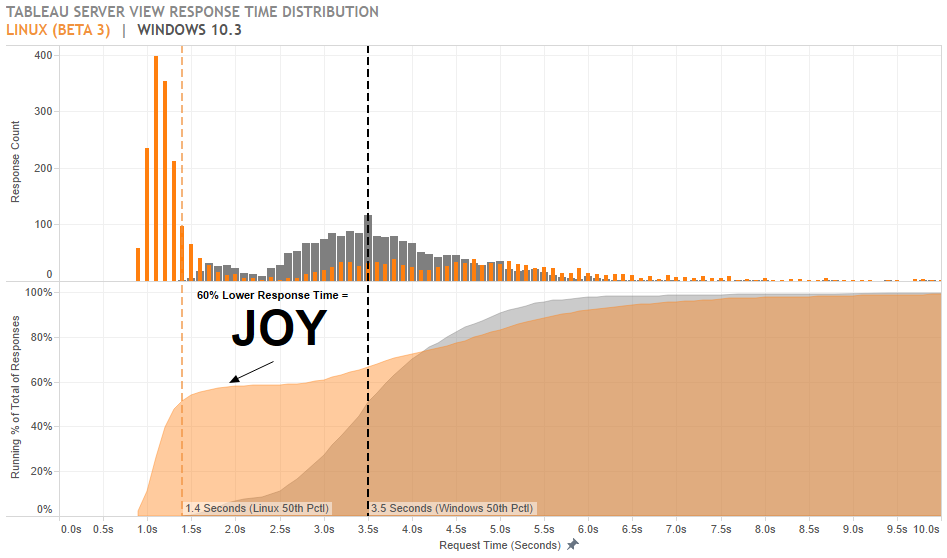
As the first post in a series about Tableau Server on Linux, I wanted to share a quick note and some promising results of performance testing in the upcoming release. The TL;DR Tableau Server on Linux = Joy. Median dashboard load times were cut 40-60% compared to the same test on Windows. Since hosting costs […]
Tableau Deep Dive: Dashboard Design – Publishing
The ultimate goal of this Deep Dive on Dashboard Design is to guide Tableau Desktop users on how to create a dashboard from start to finish. That conversation would not be complete unless we went the extra mile. I’m talking about publishing the dashboard of course. We’ll also continue the second half of our governance conversation […]
How to Pivot with Cross Joins in Tableau
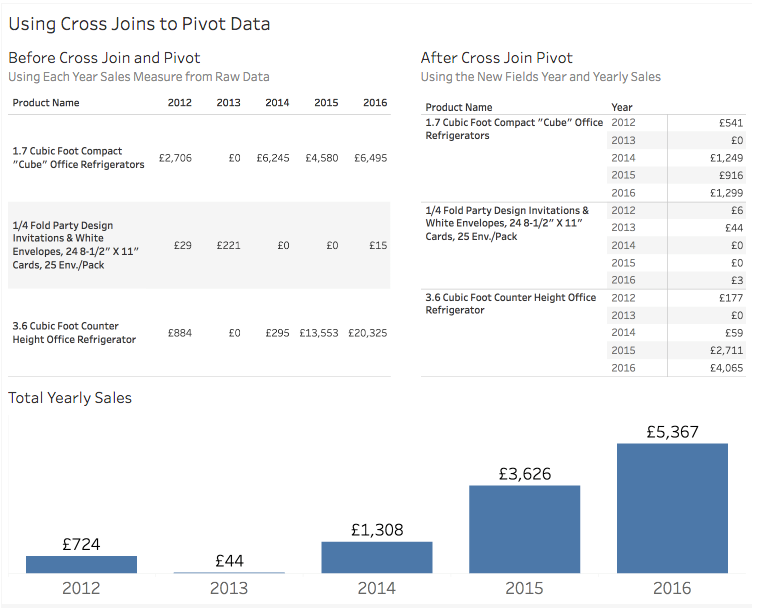
If you are not already familiar with cross joins, you may want to read through my first post in this series for another use case. In this article, I will further define and expand on cross joins. What’s a Cross Join? Sometimes we are stuck working with a non-normalised data source. Instead of a row-based […]
PYD41 – Peter Gilks – Spotify Director of Product Insights

Tableau ambassador and InterWorks EU consultant David Pires talks with Peter Gilks on this week’s episode of Podcast Your Data! Peter is a statistics veteran after working at Slalom and now Spotify as the Director of Product Insights. He’ll also be attending and speaking at the upcoming 2017 Tableau Conference about using Tableau for visual […]
Event Debrief – August 2017

If you haven’t taken a moment yet to browse through the InterWorks event page, you are missing out! Maybe it’s because the 2017 Tableau Conference is coming up, but we have more events than ever before happening across the country. And we don’t want anyone in the data community to potentially miss an event taking […]
InterWorks Blog Roundup – August 2017

As the mornings get chillier and our weekends are taken over by the TV, that can only mean one thing: the 2017 Tableau Conference is just around the corner! Sure, we’re excited it’s football season too, but autumn brings a lot more than just football. Just take a look at our events page and you’ll see it’s […]
How to Create a Time Machine in Tableau

When you think about “time,” what do you think of? Google generates time as an analogue clock face. Reading the orientation of the two clock hands is one the first skills we learn, even in the digital age. So, why not utilize this cognitive consonance when designing your beautiful data visualisations in Tableau? Trigonometry […]
Tableau on Tour 2017 Berlin: The Dashboard
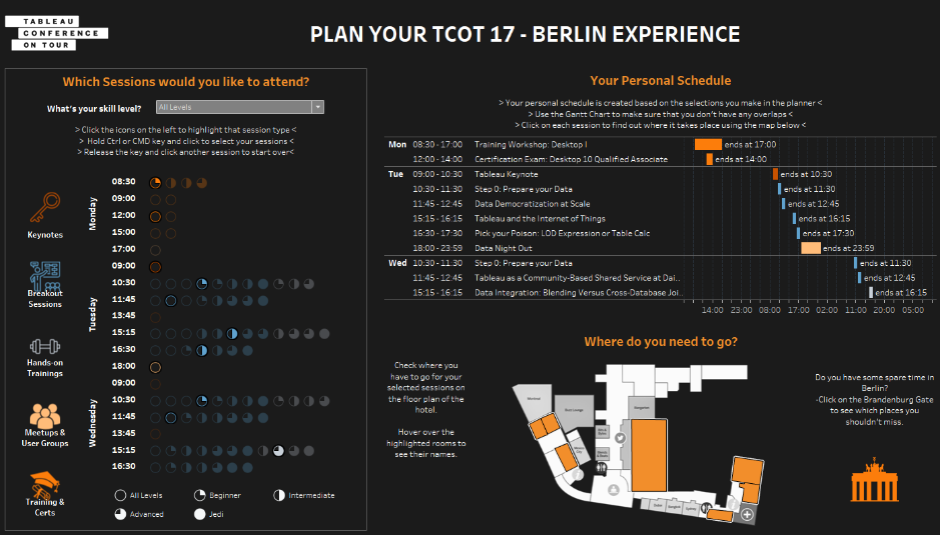
The Drawing Tool has been incorporated into CBI Studio by InterWorks. Explore CBI Studio to see what’s new. When I first started using Tableau, I was most excited to start trying out the map tool. It can take city names, zip codes or country names and turn them into map coordinates to display visual geographic data. After playing […]
Tableau Fringe Festival: How to Design Effective Dashboards

Last week, our Australian based Analytics Consultant, Robert Curtis, took part in the annual Tableau Fringe Festival. Several industry leaders took part in the day-long webinar to teach, give advice and share Tableau best practices. Although the webinar was primarily attended by our friends in the Aussie data community, we wanted to share Robert’s highly insightful […]
Tableau Conference 2017: What Happens in Vegas, Helps You with Your Data

It’s that time of year again! And no, we don’t just mean football season, although we are pretty stoked the pigskin has finally returned to our TV screens. But there’s an even bigger event that we are preparing for. The 2017 Tableau Conference is just around the corner and we can’t wait to talk Tableau, […]
