Webcast Friday: Embedded Analytics

On today’s Webcast Friday episode, I had the chance to talk about embedded analytics and how InterWorks’ Portals for Tableau solution can help increase user traffic to your dashboards on Tableau Server. You can see the full video of the webcast above, but here are the main points that we touched on today. Product or […]
Five Reasons I’m Excited for EXASOL Xperience 2017

EXASOL’s international customer meeting, the EXASOL Xperience, is July 3rd to 5th in Berlin! With less than a week to go, I’m becoming more and more excited to be part of this huge event. Aside from TCOT, Tableau’s Conference on Tour, the EXASOL Xperience will be one of the most important data events in Europe […]
Anscombe’s Quartet: The Tableau Way

Why are statistics alone a limited way to understand data? How do graphs help you understand data? These were the subjects of a 1973 paper in “The American Statistician” written by Francis Anscombe. Anscombe thought traditional statistical schooling under appreciated the role that graphs play in enhancing the understanding of data. He believed three ideas permeated academia: […]
Tableau Deep Dive: Dashboard Design – Optimization & Governance

In parts one through five of this Deep Dive on Dashboard Design, we’ve built a dashboard step-by-step that focused on planning, structure, proof of concept, interactivity and visual design. It might be tempting to end the Deep Dive series there as a finished project. The real world dictates otherwise, because we have yet to cover […]
Get Better Insight with Data Source Audit

Tableau purchased Power Tools in 2019. Contact Us for more information. Recently, our Power Tools team released a video to show the ease and effectiveness Power Tools: Deployment brings to your workbooks. Well, they’re back at it again with a demo of the Data Source Audit tool found in Power Tools: Desktop. The Data Source […]
How We Learn with Data: Part 1 – Can You Learn This Stuff While You Sleep?

“How We Learn With Data” is a series that focuses on the path of learning each of us takes when we are working with, or trying to make sense of data. Take a wander with us through psychology, education theory, philosophy and history. This is an excellent resource if you are bringing data technology into […]
The Expected and Unexpected of Being Support Queen for OK Freewheel

You know that “I’ve made a huge mistake” moment when you realize you have, once again, committed to something that is most likely going to kill you? Somehow, of my own free will and volition, and under no duress or coercion, I managed to volunteer myself as Support Queen for the InterWorks team for OK […]
Resources from the ‘Advanced Analytics Done Right’ Webinar

Predictive analytics is more than just dragging and dropping tools in to your workflow. Predictive analytics drive business critical decisions and help us analyze real-world problems like customer churn, recommendations and targeted marketing campaigns. Alteryx simplifies the process of training predictive models but you want to make sure they are built in a way that you […]
Compare Your Care: Which Hospitals Get Top Ratings?
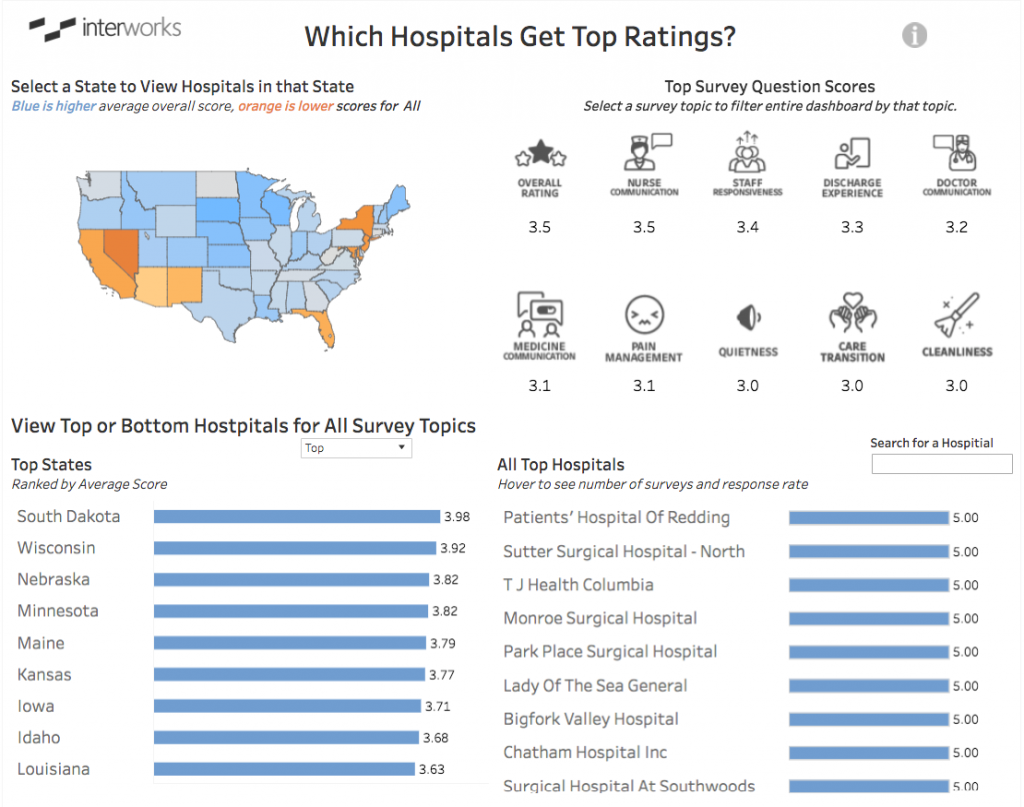
Have you ever spent time in a hospital? If you’ve been treated at a Medicare certified hospital, there’s a good chance you filled out a survey indicating the quality of care provided to you. The Centers for Medicare and Medicaid Services (CMS) has made data from over 4,000 hospital surveys available to the public, including […]
Questions from Tableau Training: Dynamic Label Positioning
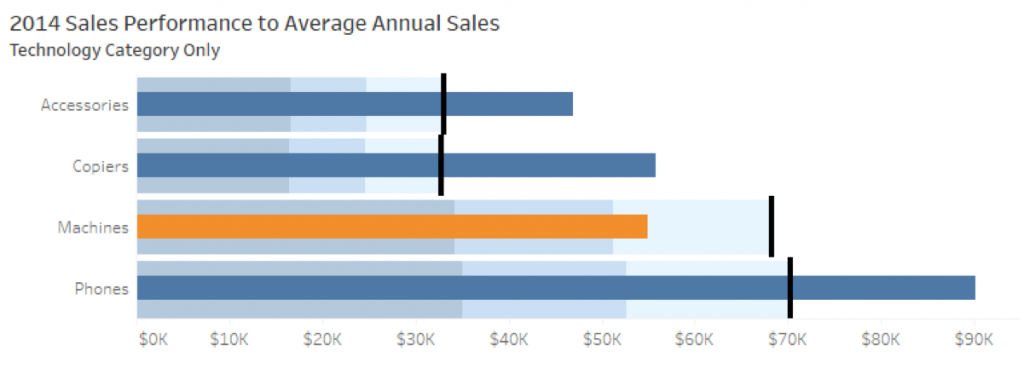
From a Desktop II Intermediate class in Melbourne, Priyanka asked me the following question: “In my chart, I want to show forecast and actual as a bullet graph. I’d like to label both values at the end of the chart, whether that’s the bar that’s exceeded goal or just bullet if the goal hasn’t been […]