
Tableau is a great piece of software geared towards business users and rapid, iterative data analysis. Its interface makes it as easy as never before to connect to a vast number of different data sources and create stunning and meaningful visualizations. But what’s happening in Tableau’s engine room when you drop that blue pill on the rows shelf, set a filter or use table calculations? If you don’t fear some technical terms (only a few, I promise!) and want to learn more about the product you’re using on a daily basis, stay tuned for more posts of this blog series! Tableau is a powerful query generator and in-memory calculator, meaning that it can push most of the work to the database as well as calculate measures based on the returned results. Not bad at all! Easy does it – let’s start with the basics:
Simple Aggregates
Simple aggregations happen when the data requested for viewing in Tableau is rolled up to a lower level of detail than its original level of detail in the data source. Since a picture (or a visualisation) says a thousand words I captured this fact by adjusting the size of the individual boxes. Lots of rows of raw data, less rows of aggregated data. This aggregated data is then processed by Tableau, either going straight to rendering your visualisation, or calculating certain metrics that you have set up in calculating fields. This chapter will focus on how this aggregation happens and provide all the necessary details needed to lift the veil on what goes on in the background.  When you drop [Region] and [Sales] onto your worksheet, Tableau will generate the matching query and run it against the database you’re connected to. Once the database returns the results they are rendered as marks in your visualization, which by now probably looks something like this:
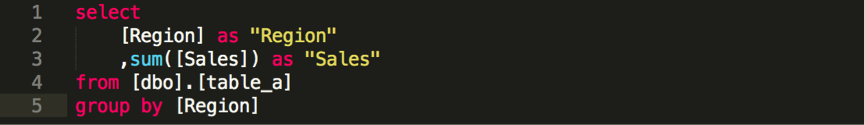
  But what happened in the background? While you were watching the magic happen, Tableau sent the following query to the database. To those of you who suffer from a severe adversity towards code, hang in there, you’ll be surprised how easy it is:
  This roughly translates to “Give me the sum of [Sales] for each [Region]”. By that point, Tableau itself never had to dig through countless rows, but instead got served the already aggregated results to render as you saw fit. You can check this by clicking analysis -> view data, …
  … which opens a window looking like this:
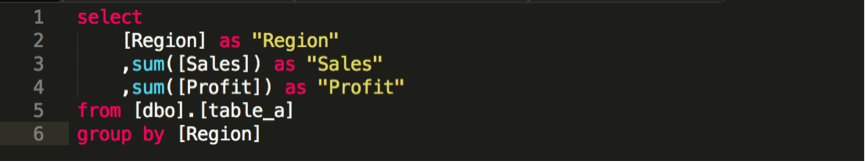
  Neat! Let’s introduce a second measure to the party, shall we? Dropping [Profit] onto our visualization will prompt Tableau to generate a query along the lines of “Give me the sum of [Sales] as well as the sum of [Profit] for each [Region].”. Lo and behold, the query:
  Again, all work at this point is done by the database and Tableau only reads the resulting aggregated dataset:
  Now let’s do something with these two measures, like dividing profit by sales in order to find our profit margin. We can do this by using calculated fields, but there are two ways of doing this: the right way and the wrong way (I’ll circle back to this statement in a bit). Users who are new to Tableau might create a calculated field like this:
  While this will return arithmetically correct results, the analytical use is somewhat questionable. What just happened is that Tableau was told to ask the database for the profit margin for every single row and then calculate the average of those margins for each [Region].
  More seasoned users will create a calculated field as follows:
  This will prompt Tableau to ask the database for the sum of profit as well as for the sum of sales for each Region, letting the database do most of the work and return the result set. Tableau then does the math in memory and presents you with a crisp profit margin for each region.
  Much better. Remember when I said that there’s a right and a wrong way? It really depends on what you want to see, but in this particular case a weighted profit margin is the desirable measure. Imagine the following: One salesman sells a smartphone for $600 with a profit of $450, so at a profit margin of 75%. Another salesman sells one of those European small cars for $20000 with a profit of $2000, so at a profit margin of 10% – calculating the average of those two margins returns 42.5%, a number simply too good to be true. Instead we want to sum up all the sales as well as all the profits, and only then run the calculation: $20600 in sales and $2450 in profit computes to a more realistic profit margin of 11.9%. Phew.
Disaggregate Measures
Now that we learned about the ins and outs of basic aggregate measures in Tableau, let’s move on to the opposite: row level data. Sometimes you don’t want or need Tableau to aggregate measures, for example when creating a scatter plot on the hunt for outliers. Instead of receiving a shorter and rolled up set of data Tableau will request the data at row level before computing and rendering it. Again, the size of the individual boxes on below image capture that fact.  Back to the scatter plot, in this example based on [Region], [Sales] and [Profit], like so:
  Telling Tableau to plot every single profit and sales value including the respective region is not a particularly hard thing to do, but as you probably have correctly guessed I have a screenshot for that, too. Here we go!
  Now watch as the marks count on your scatter plot skyrockets. This happens because by unticking the “Aggregate Measures” option you changed the way Tableau queries the database. Instead of returning the sum of profit and the sum of sales, the database now delivers every single value for profit and every single value for sales to Tableau:
  And the query behind this visualization looks like this:
  As you can see this query does not have a group by clause, which leads the database to return every single value for region, sales and profit. Feel free to experiment with your own data and Tableau’s view data feature. Pretty simple, right? Time to move on to the next topic:
Simple Filters
All Tableau users will sooner or later have used a filter, so let’s take a closer look at how they work. Filters can be easily created by either dropping dimensions or measures alike onto the filters shelf and setting which members of a dimension or values are allowed to show in your visualisation. Tableau then adds them to the query it runs against the database to limit the returned results as desired. Those filters can apply both to data on row level as well as aggregated values, as depicted on the image below, and in this chapter I will explain how that all comes together.  First up: filters on dimensions. Let’s assume we want to see the profit and sales for one Region only, for example East. Tableau smartly generates a new query that looks like this:
  As you can see Tableau added a where clause to the query that tells the database to scan through the regions and only return results for the East region. But what is so smart about this? Tableau will try to minimize the work the database has to do and will adjust the query accordingly. That way, when we want to see the results for all regions but the East region, it doesn’t tell the database to include the regions North, South, West and Central, but instead tells it to exclude the East region:
  Not bad, huh? Now that we’ve covered a filter on dimensions, how about those filters on measures? We might want to see all the regions, where the sum of profit and the sum of sales are above or below a certain threshold. Simply drag the measures on the filter shelf and set the measures to be at least or at most a certain value and hit okay.
  The matching generated query reads as follows:
  See how Tableau left out the where clause but instead wrote a having clause which sits after thegroup by bit? This happens by necessity as integral part of all SQL flavours and Tableau takes this load off your mind, allowing you to focus on the analysis at hand. And if you want to filter for measures in a specific range, just set the filter to a range of values and Tableau will translate this range into a having clause:
  Great, you have made it that far. That wasn’t too complicated, right? How about taking that little break you have been putting off? We’ll be right back with the second blog post of this series featuring more interesting insights around data segmentation using Tableau’s sets, table calculations and Tableau 9’s brand new Level of Detail calculations. All generated queries have been tracked using the Performance Analyzer, one of the tools available with the InterWorks Workbook Tools Suite that was created to make batch and automatedinteractions with Tableau workbooks possible. Did you find this useful? Let us know in the comments section and keep tuned for more blog posts covering the most interesting topics on Tableau. If you have any questions, please feel free to send me an email or, if you’re ready to download Tableau, click here to get started on a free 14 day trial!