PYD35 – Alan Eldridge – The Last Data Bender

Alan Eldridge, Tableau’s first full-time local employee for APAC, joins our own Aussie, Robert Curtis. Together they explore what makes Tableau and its community unlike any other, how Tableau is able to meet the demands of both SMBs and Enterprise customers, the future of Tableau and much more. You won’t want to miss Alan’s top […]
Tableau Deep Dive: Dashboard Design – Visual Best Practices

A lot of the hard work is done when it comes to planning and building our Tableau dashboard. Up until now, we were asking business questions to help frame the requirements of our reporting tool and technical questions on how to build it and expand the functionality. Now, we are going to take our Deep […]
Compare the Latest Date to Weekday Historical Average

In the final installment of this series on time-based comparisons, we are diving into comparing a single day’s performance against the historical performance for that particular weekday. To clarify the purpose of this post, suppose that the most recent day you have recorded is a Wednesday. How do you go about assessing if performance was […]
Global EV Sales for the USA and China

This morning I read a post on global EV sales. I was surprised by how large the Chinese automotive market has become. Total automobile sales in the United States for all of 2016 were 17.55 million units, an all-time record. The still nascent Chinese auto market generated 28.03 million units of sales for last year, […]
Third Year Straight InterWorks Places on CRN’s Solution Provider 500 List

For the third year running, InterWorks has been named to CRN’s 2017 Solution Provider 500! This comes on the heels of InterWorks earning a spot in Inc. Magazine’s national list of Best Workplaces. Best Work, Best Clients… So, it’s safe to say we are more than excited for the good press and overall recognition for […]
Webcast Friday: Intro to Cloud Services – Office 365

On today’s Webcast Friday, I got to talk in part on the capabilities of the Cloud, but mostly wanted to showcase the versatility of Office 365. InterWorks is a proud partner of Microsoft, and we enjoy and utilize Office 365 on a regular basis. So, if you missed my live demonstration of what you can […]
How I Went from Aspiring Broadway Star to Oxford Grad Student to Content Strategist

Do you remember how you used to sign your friend’s yearbooks at the end of each school year? You would write “HAGS!” (Have a great summer!) and they would put “LYLAS!” (Love you like a sister!) in yours. Well, while growing up in Mustang, Oklahoma, I remember my fellow classmates would write in my yearbook, […]
Experiencing Tableau Conference on Tour London
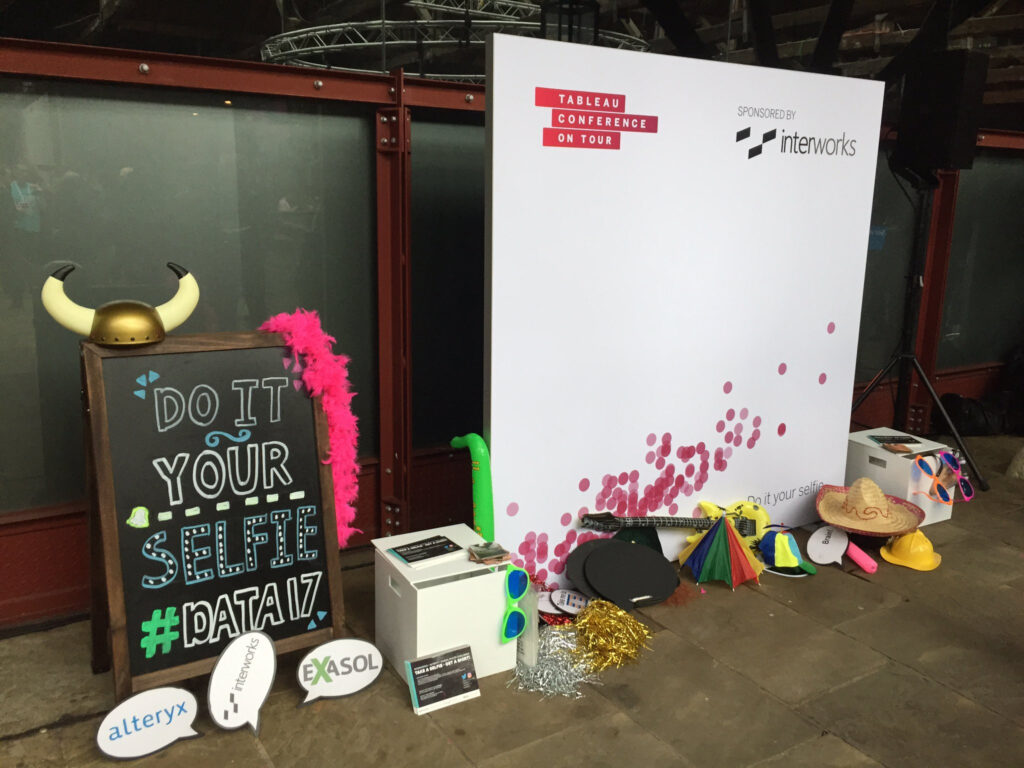
Tableau Conference On Tour London has come to an end, but what an event it was! It was a privilege for InterWorks to be a sponsor and have the opportunity to see some old friends and make new ones. InterWorks often talks of the Data Journey and we had the opportunity to hear from you about […]
Shading the Delta Between Running Totals in Tableau
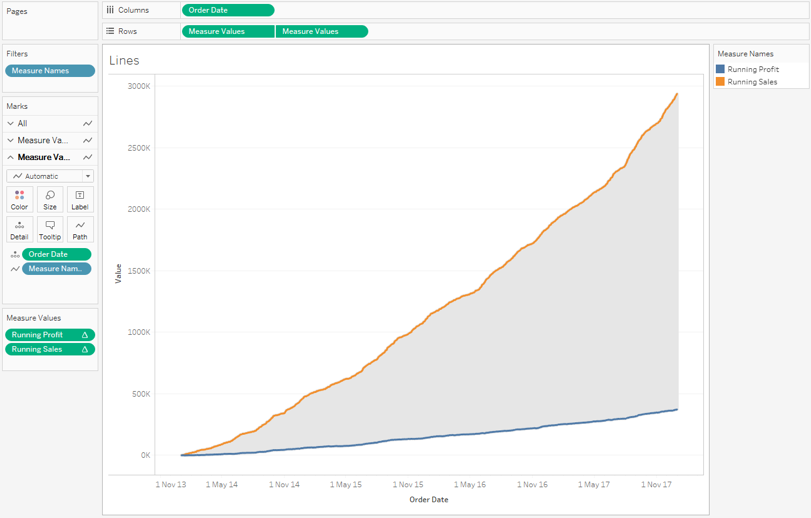
During the Tableau Conference on Tour in London last week, we were approached with a new challenge from one of our clients. The requirement was to highlight the delta between two running total lines, like this: After spending the better part of an hour tackling the problem in typical Tableau fashion, it became clear that […]
Book Review: The Big Book of Dashboards

I’ve known the authors of The Big Book of Dashboards for quite a while. They are all skilled users of Tableau who started as customers and evolved into experts over time. Steve, Jeffrey and Andy provide insight gained from years of dashboard-building experience in this book. Organization There are three major sections in the book. The […]