A few weeks ago, during one of the Tableau sessions we like to do between BI consultants at InterWorks, Dave showed a Tableau trick he used to make map visualisations in Tableau more dynamic and intuitive for the end user. The trick was a smart use of a blending on the level of detail to swap between two map types on the same worksheet.
What do we want to achieve?
We want to allow the end user to drill down from a country filled map to a dotted city-level map.
Let’s take a visual example with the end result:
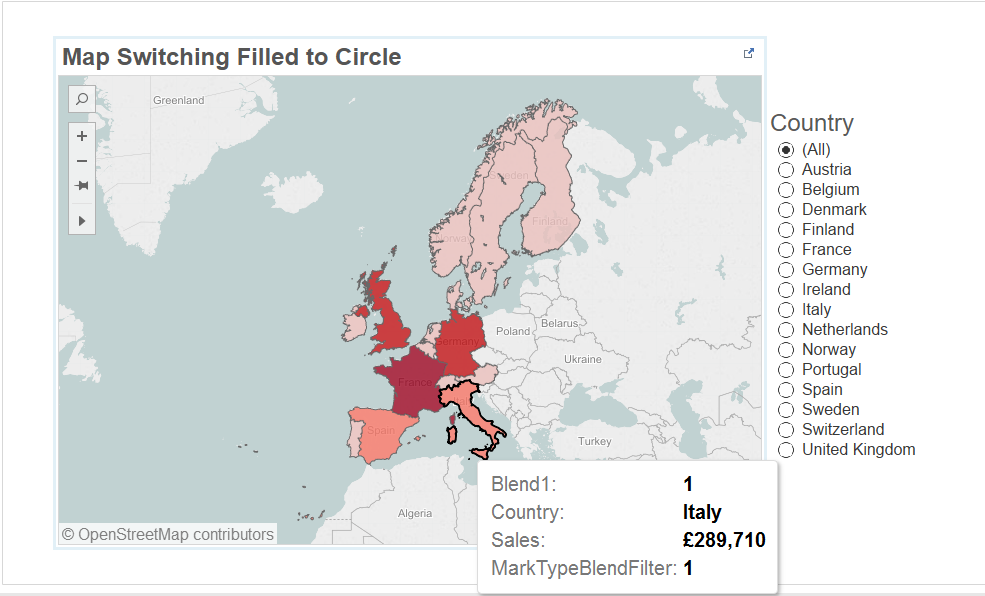
The first “layer” of this dual axis map is a filled map showing the sales at a country level. When I hover over one of the countries, you can see the Sales measure and the Country dimension in the tooltip. To know which blend we are on, we left the blend value and the parameter value we use to switch: Blend1: 1 / MarkTypeBlendFilter: 1.
Now if I click on one of the country, I can drill down to the city level of detail:
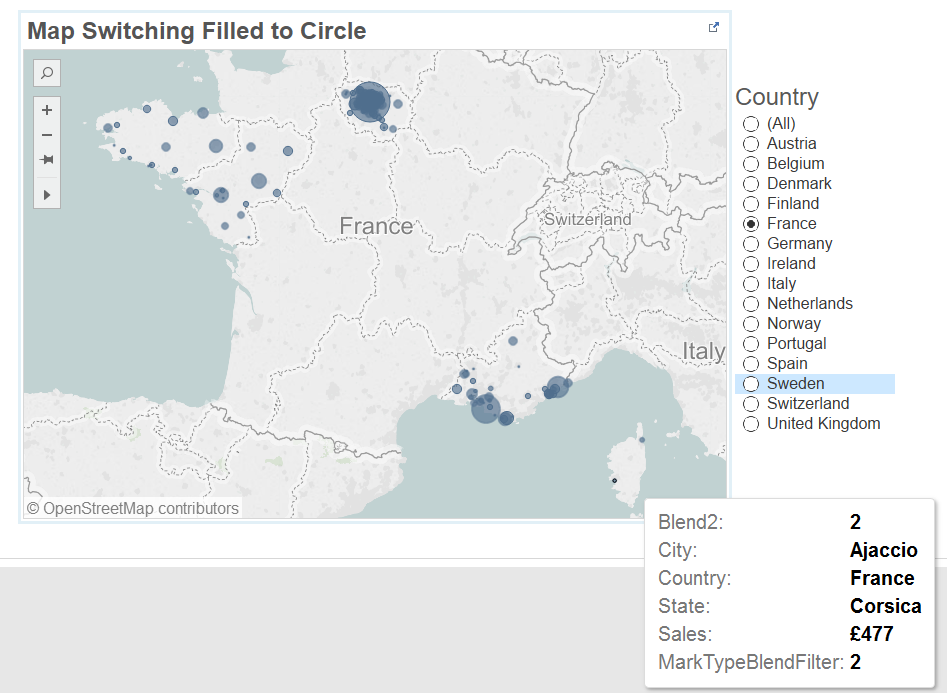
When we hover over a city dot, the mark details have changed and are now at a more granular level. The blend dimension and the parameter value have changed.
Let’s break it down to the major steps:
- How to have two visualisations on the top of each other? > Dual axis (have a look at this nice trick for dual axis double colouring)
- How to filter out one visualisation out of the other? > Play with different blended dimensions put on the level of detail of each axis.
- Create a dummy data set for the blending and blend the created dimension to use them in the mark cards
- Create a calculated field condition to swap between the maps
- How to click to filter? > Worksheet or dashboard action
- Polish everything
The step-by-step explanation is below.
Getting Started: Primary Data Set & Setting Up the Visualisation
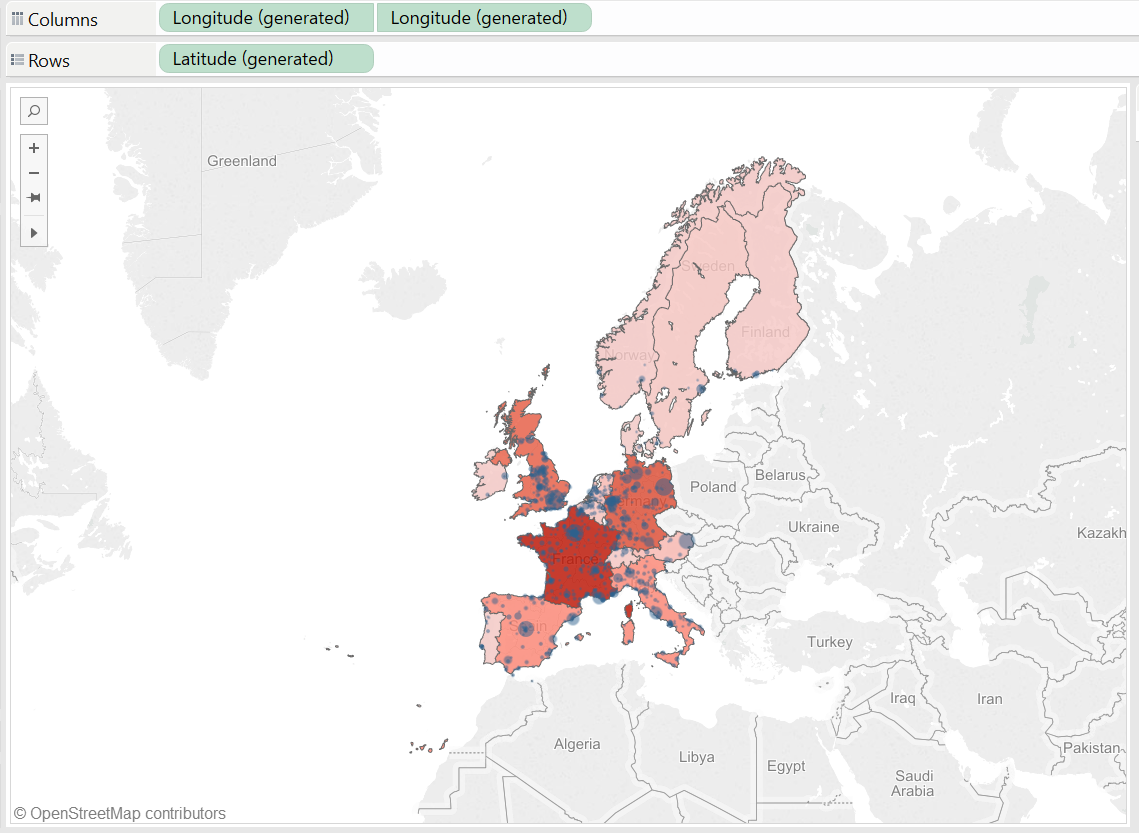
For this blog, I used the good old Superstore data set available in the data folder of your Tableau repository. The first thing to do is to create a map and to duplicate either the latitude or longitude generated.
We want then to change one of the map type to “filled map” and create a dual axis map. The two maps are on the top of each other, but we can now play with them independently. To make it more obvious, I also used contrasted colour for each map type and added a sales indicator (colouring the filled maps and sizing the cities of the dotted map).
Blending & Clipboard
To be able to swap between the two maps on the same graph, we need to create a dummy data set on which we will be able to blend. This is what it looks like:
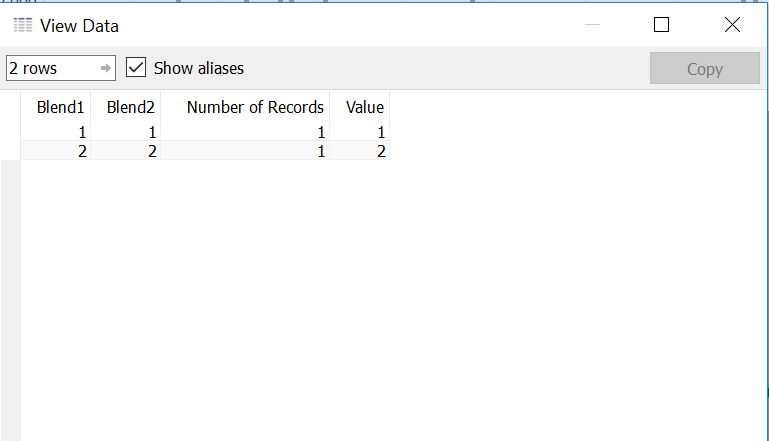
Trick: Simply open an Excel spreadsheet and enter the column names and values, then copy paste directly into Tableau and an automatic clipboard will be generated. Details in Tableau article here.
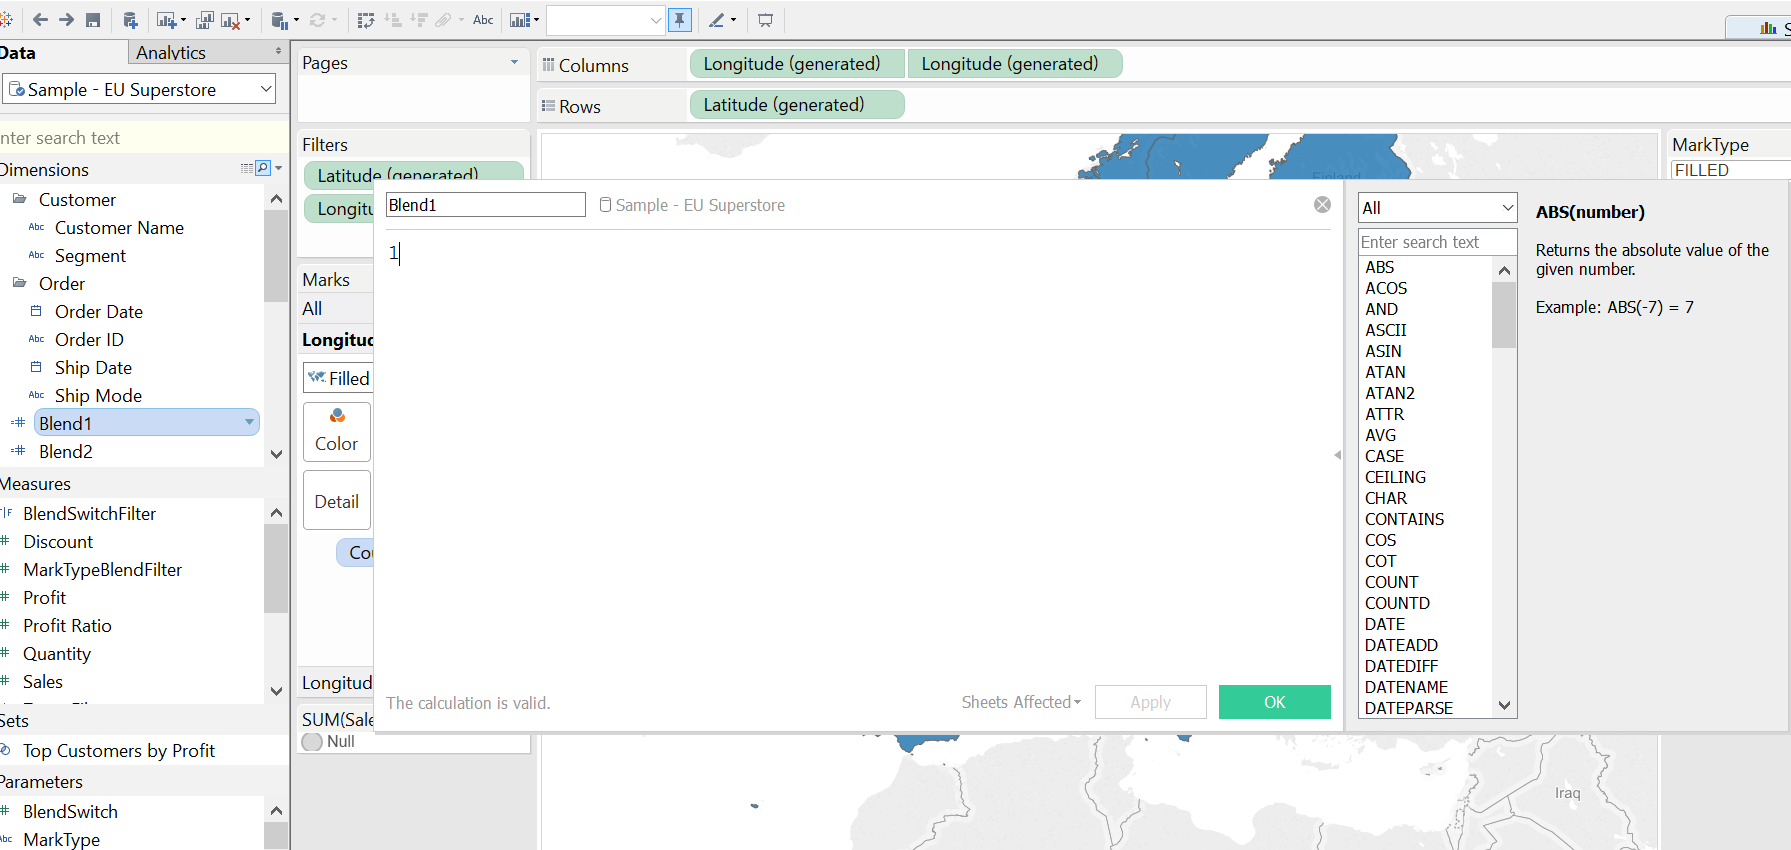
In order to blend these dimensions, we create two calculated fields “blend1” and “blend2” in our primary data set (Sample Superstore) that are simply named the same and respectively equal to 1 and 2:
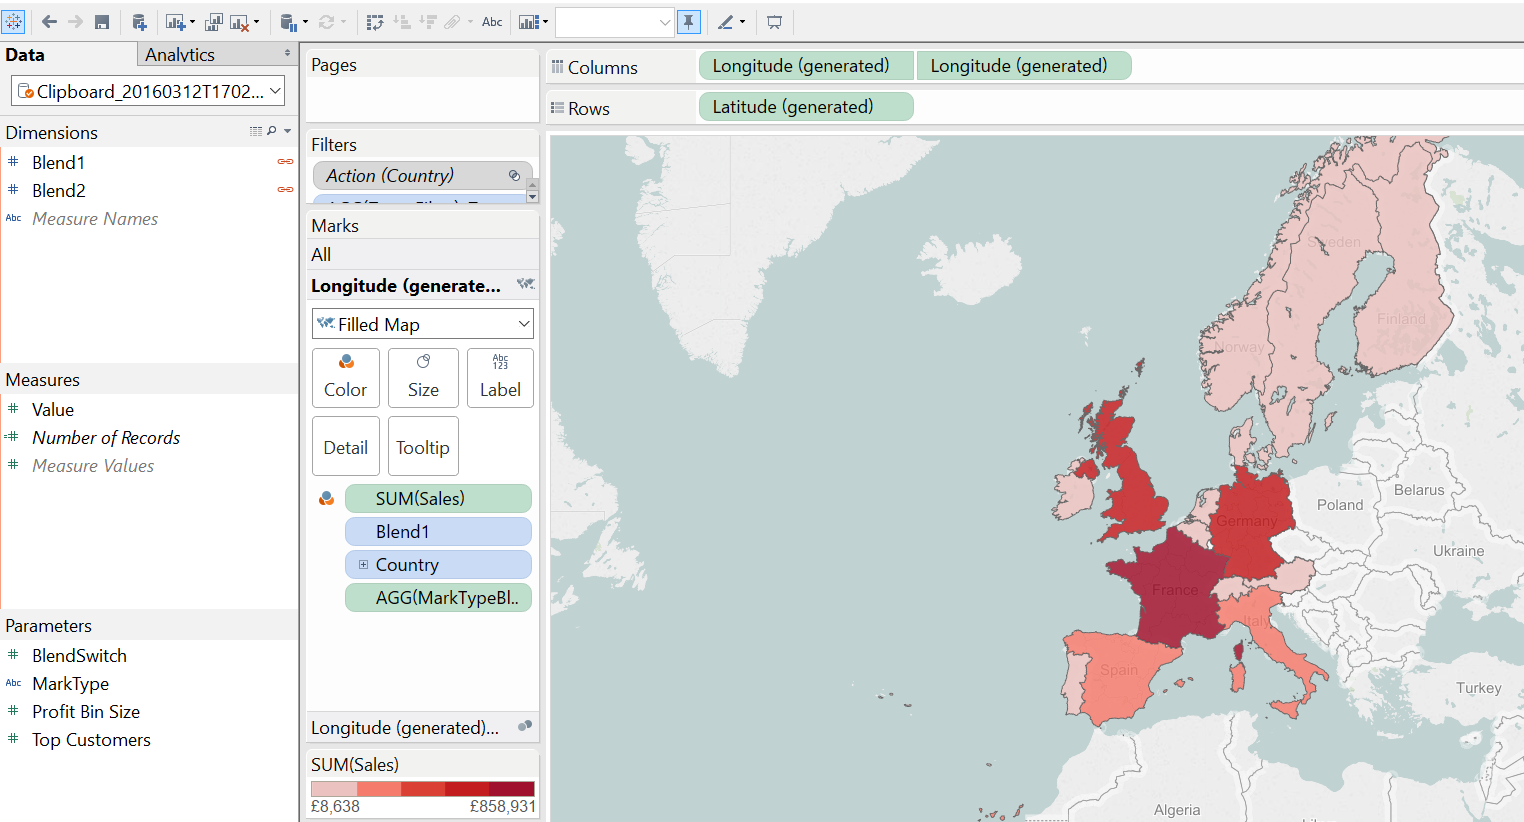
We then go to our clipboard data set to blend the dimensions (Tableau blends them automatically because they have the same column names):
Swapping Between Maps: Blend on Mark Detail & Calculated Field
We’re close. Now what we are interested in is the “Value” measure of the clipboard. We’re going to use it to swap between blend1 and the blend2. To do so, we bring blend1 onto the Mark card of our filled maps and blend2 onto the Mark card of the circle map (it does not matter which data set you’re using).
We then want to create a condition to determine which map we want to visualise. We can do that with a calculated field that is equal to the Value measure of our clipboard (either 1 or 2):

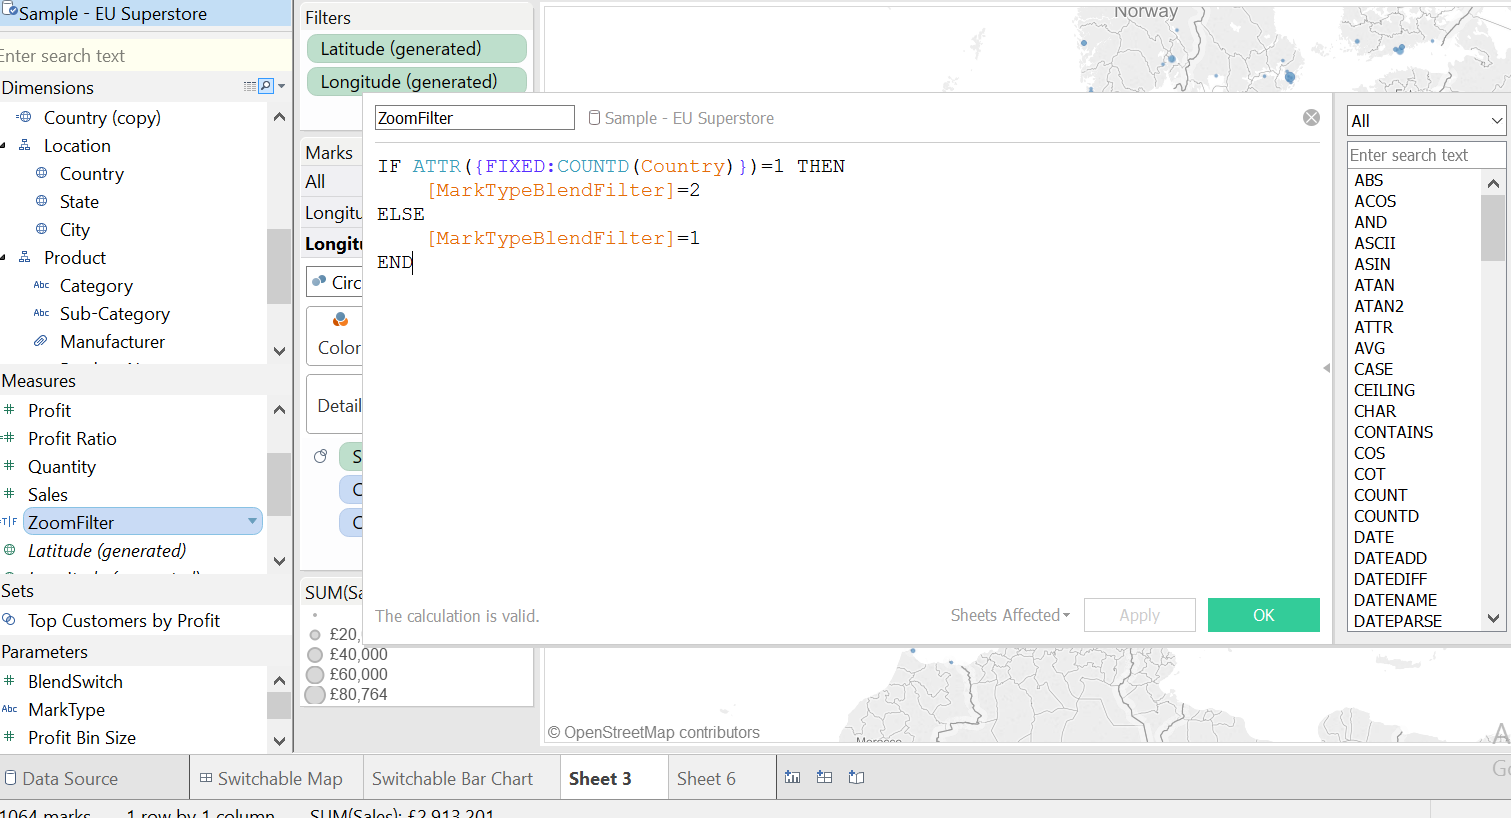
Then, we need to create a Boolean calculated field that will filter in and out one of the maps at a time. To achieve that, we use an LOD to fix the filter selection to one country, and we place this calculated field into our Filter shelf:
What are we doing here?
The LOD looks through all the data relevant to the context filter (which is driven from the action we are going to build later). When you have not selected anything, there are 15 countries in the view. So, this value is 15. When you select a single state, the action filter drives that state as a context filter. The context filter comes into play before the FIXED calculation.
We’re telling Tableau that if there is one country selected, then the value of the blended dimension must be equal to 2. We do this so that Tableau looks for the maps with that feature (the circle maps) and displays it. Otherwise, it picks the filled maps.
We’re even closer, but at the moment this still does not work yet. Using an action is the smart way to make this calculation work. See why below!
Dashboard Action onto Single Field & Polishing
We finally built a dashboard containing our worksheet and created a select action to fake the “zoom” into a country:
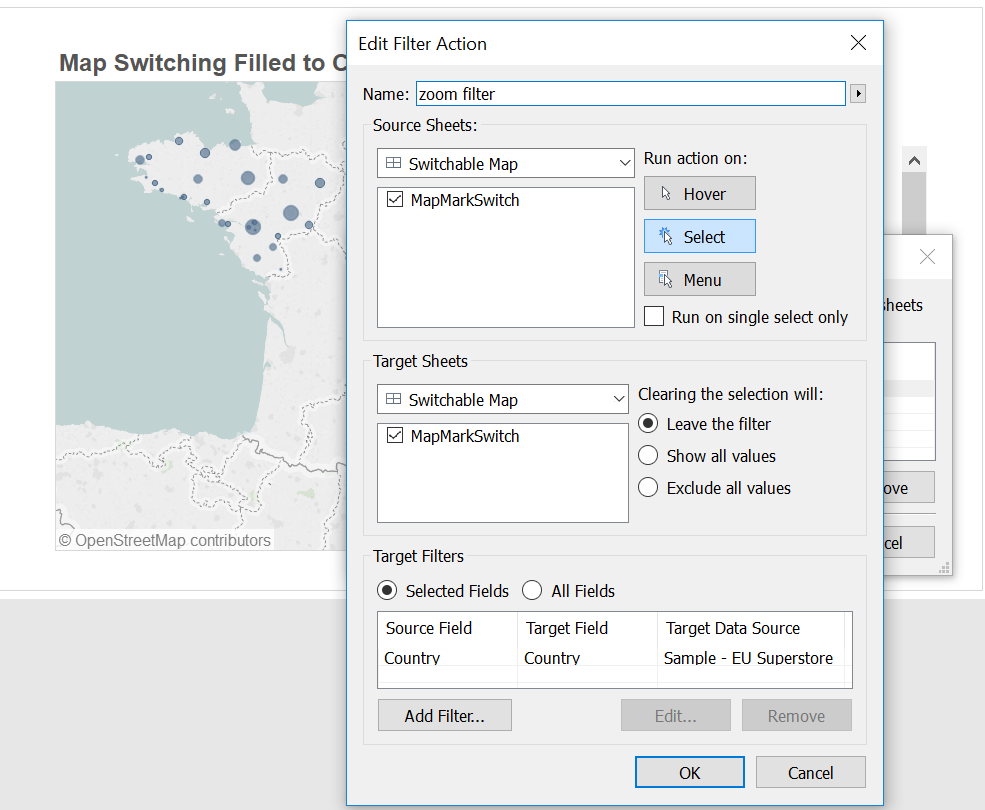
The hack here is to set the target filter to the selected field country. By doing so, when I select one country, the count distinct for the country dimension is … 1. And when the count is 1, I want the “Value” measure to equal 2. The map that has this feature is the circle map, as explained above. When the count distinct of country is different than 1 (several countries), then Tableau does the opposite and displays the filled map. Tada!
The last bit is to make the action filter visible so that the end user can zoom in and out of the map, as we see in the first screenshots.
Access the workbook here, or interact with it below. Feel free to post comments!