The Desktop User’s Guide to Tableau Server
Are you a Tableau Desktop user who is new to Tableau Server? Do you find yourself confounded by all of the thingamajigs and whatsits, and just want someone to tell you what you need to focus on? If so, then you want this post. In this post, I’ll walk you through the fundamental things you […]
PYD08 – Carlo Ratti – Architect, Engineer, Inventor, Educator

Carlo Ratti joins InterWorks’ own Dan Murray to talk about his MIT research, the internet of things, design and how we can get more feedback from our environments.
A Look at College Enrollment and Women in Business Leadership
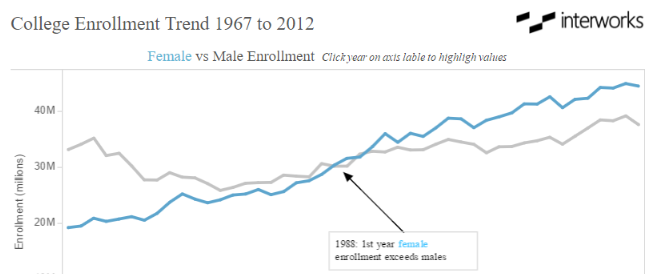
During my email scan this morning, I noticed an interesting post from Statistica regarding women in board leadership roles by country. Norway had the highest percentage of women board members (39%) while the United States (12%) was ranked was well down the list at #8. I decided to look into the number of women enrolling in […]
Using Addresses to Create Maps in Tableau
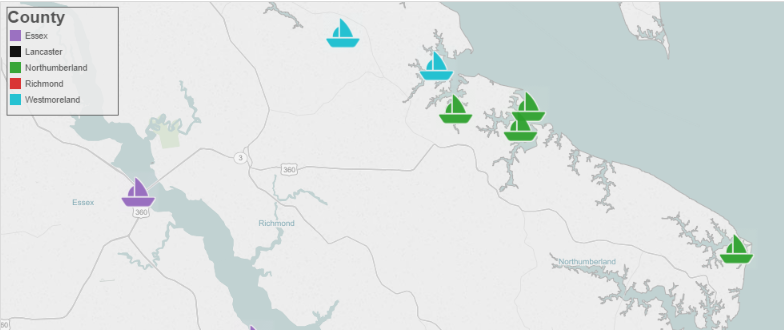
We all know that we can create some pretty cool maps in Tableau using fields like City, State and ZIP Code; however, Tableau cannot natively map street addresses. In order to plot specific addresses, we’ll need to use latitude and longitude coordinates. Through the use of some free online tools, we can convert addresses in […]
Tableau Driver’s Ed: Data Sources
“Without data, you are just another person with an opinion.” – W. Edwards Deming, Statistician, Author, Consultant Tableau without data is just an interface, a car without gas. The more usable data sources that you can add for your report creators the better. In this article, we’ll present some principles to help guide you on […]
Editing Colors in a Tableau Highlight Table with Grand Totals
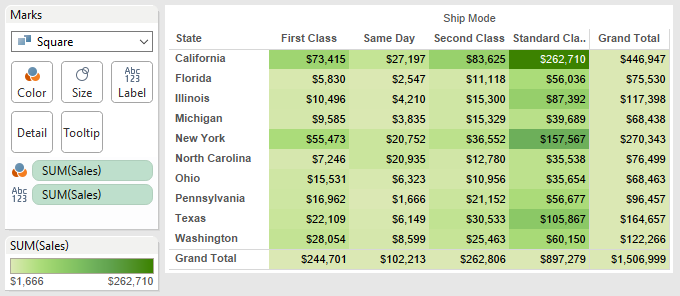
When going through training, people are often introduced to highlight tables and are immediately intrigued. That’s because they allow us to create a standard crosstab but use color to call attention to certain values (high or low). But how do we edit colors once we create a highlight table, particularly when totals are involved? Let’s […]
Tableau Driver’s Ed: Building Workbook Templates
One of the most effective ways to teach someone a new skill is to get them working hands on in the subject matter. The sooner you can bring your team into Tableau and get them playing with data marks, views and dimensions, the better. In today’s article of the Driver’s Ed series, we’ll explore how […]
Open Data Viz: Visiting Our National Monuments
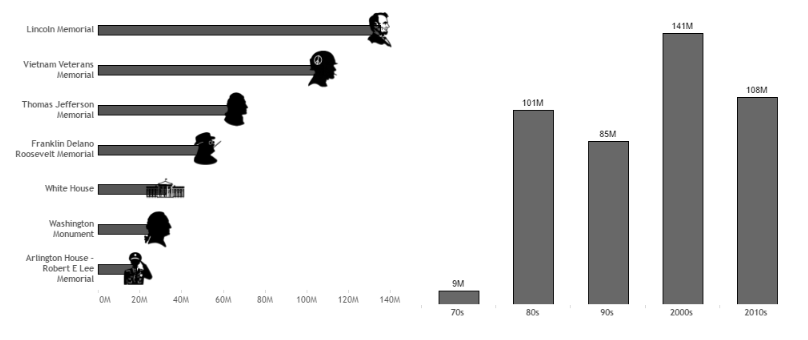
Washington, D.C. is one of the most beautiful and historically rich cities in America. As someone who has lived in the area for over a decade, I can vouch for one park that never disappoints – the promenade between the Capitol and the Potomac known as the National Mall. It is a must-see for tourists […]
Exploring History with Tableau: World War II
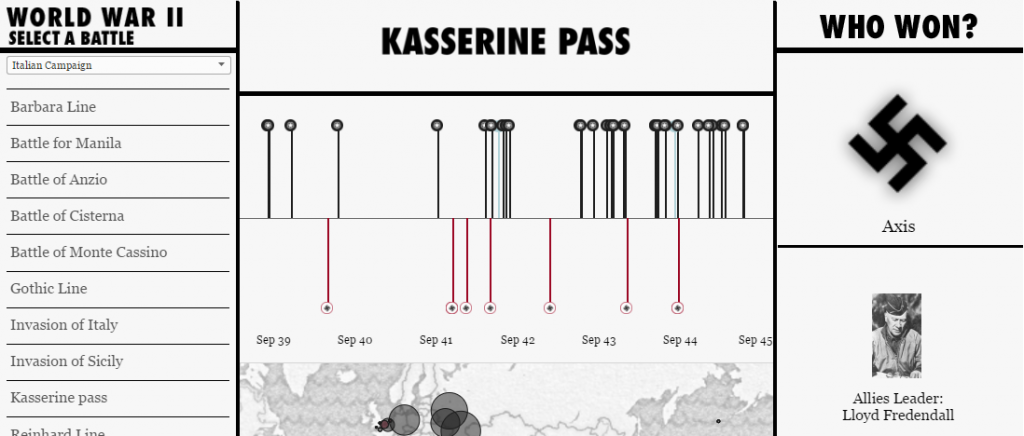
George Santayana once said that “those who cannot remember the past are condemned to repeat it.” Every history professor I had from high school through college repeated some variation of that phrase. At one point, I hated history. I could not force myself to memorize dates and names; it didn’t come as easily as math […]
A New, Improved Color Tool for Tableau
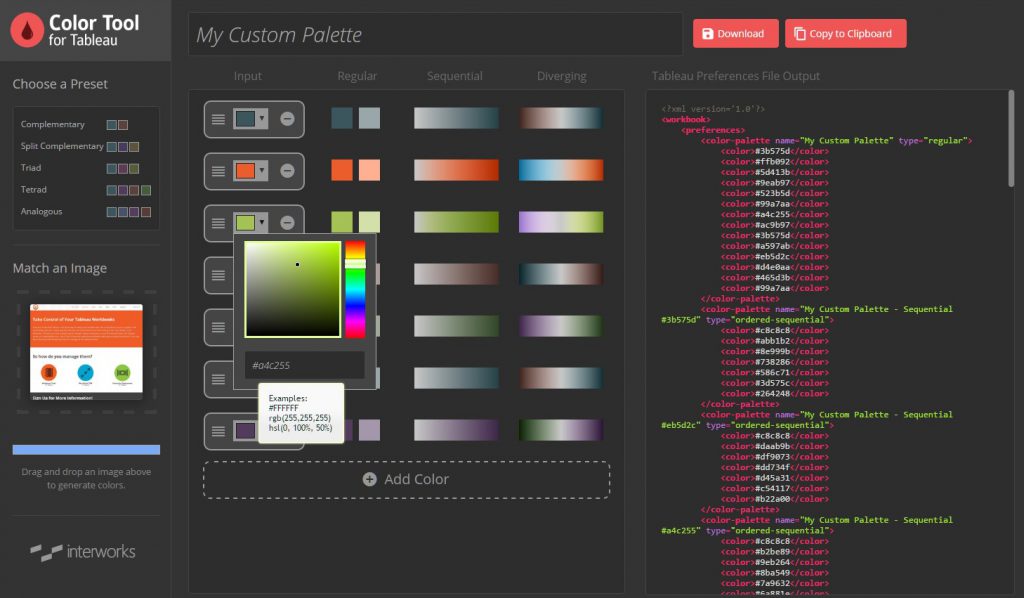
Tableau purchased Power Tools in 2019. Contact Us for more information. Tableau users should not have to write code to create and save custom color palettes. Although Tableau gives us some options for customizing colors, it isn’t easy to save those for repeated use. Creating custom palettes requires manually editing the Preferences.tps file, writing XML […]
