PYD03 – Robert Rouse – Tableau Zen Master and InterWorks Analytics Consultant
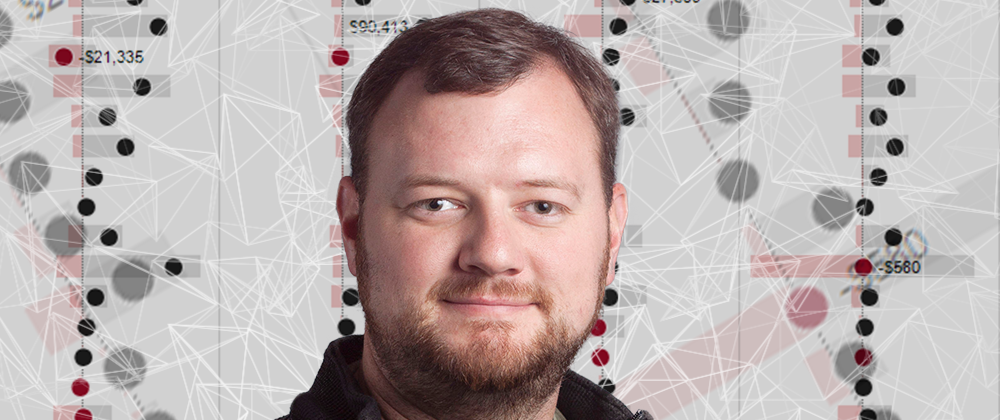
Tableau Zen Master Robert Rouse joins Tim Costello to talk about our perceptions and the way we view data. Tables in the East? Before you fire that manager, maybe take a second look.
Why You Should Take Tableau Fundamentals
This article is about why you should take the Tableau Fundamentals course. Yes, you. I know that you’re a self-taught guru that’s been working in the tool every day for nine months. You’re the local data analytics guru in your organization. Who needs the Tableau newb class. Just go straight into Tableau Advanced training and […]
Inline Notations in Tableau
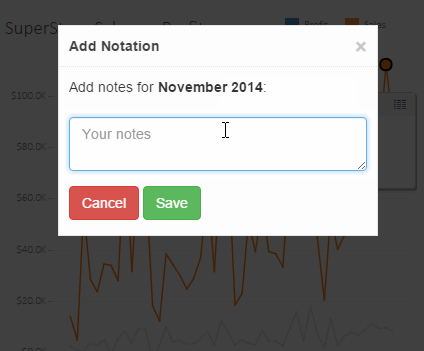
Tableau Dashboards are great for a lot of things; however, one need I hear often is the ability to add notations to dashboards. You can obviously add notations inside Tableau Desktop, but in an Enterprise level dashboard, there are many issues with this approach. Any user annotating your dashboard would need access to edit the Tableau file. […]
Free The Parameter – Giving Tableau Users Full Control
Tableau is great tool to dive into data. Sometimes it can be difficult to keep your dashboards nice and clean. Especially, when filters and parameter filters are all over your sheets. This blog will show you a way how to hide and show parameters on a dashboard. If you want to know how to set […]
ICYMI: Dan Murray Continues the ‘Tableau Your Data! 2nd Edition’ US Book Tour
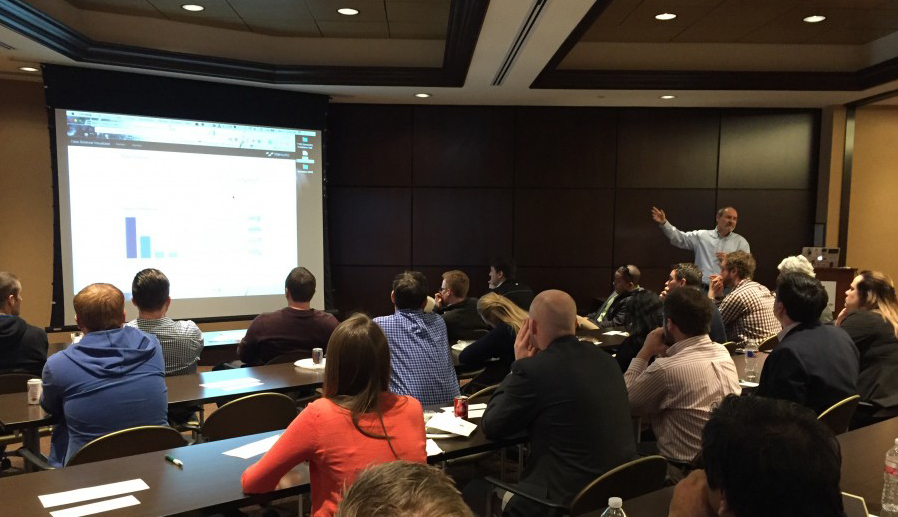
You may have seen us buzzing about the 2nd edition of Tableau Your Data! lately, but did you know that author Dan Murray is currently midway through his U.S. book tour? Over the past two months, Dan has travelled from coast to coast, stopping in on local Tableau User Group meetings to share the latest wisdom […]
Quantified Office: Part 3 – Gathering Data with IFTTT
In Part 1 of this series, I shared our Quantified Office Tableau dashboard and explained the idea behind it. In Part 2, I demonstrated how we created a “sunrise chart” in Tableau. By now, you are likely wondering how exactly we gathered the data for our kitchen experiment. With the combined technology of IFTTT and a […]
Microsoft Exchange 2013: OWA Signature Error
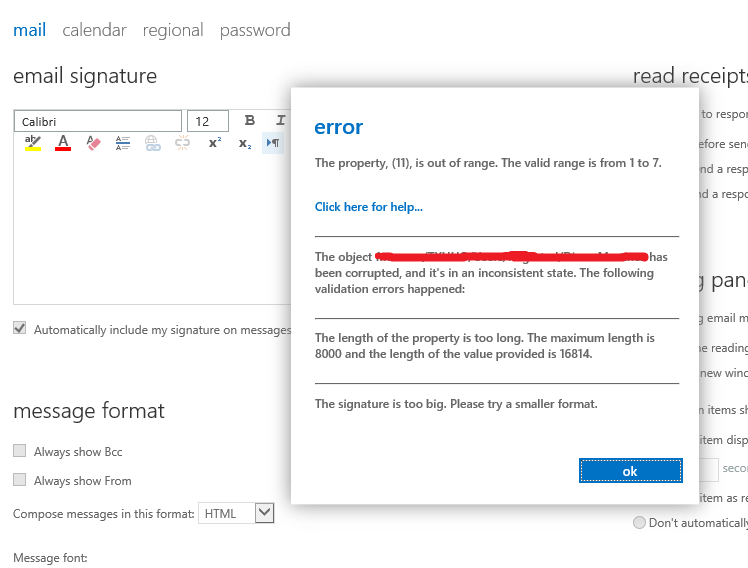
In Microsoft Exchange, you may have received these error messages: “The signature is too big. Please try a smaller format.” “The Property X is out of range, the valid range is x to x.” “The length of the property is too long. The maximum length is 8000 and the length of the value provided is 16814.” […]
SXSW 2016 Interactive Sessions
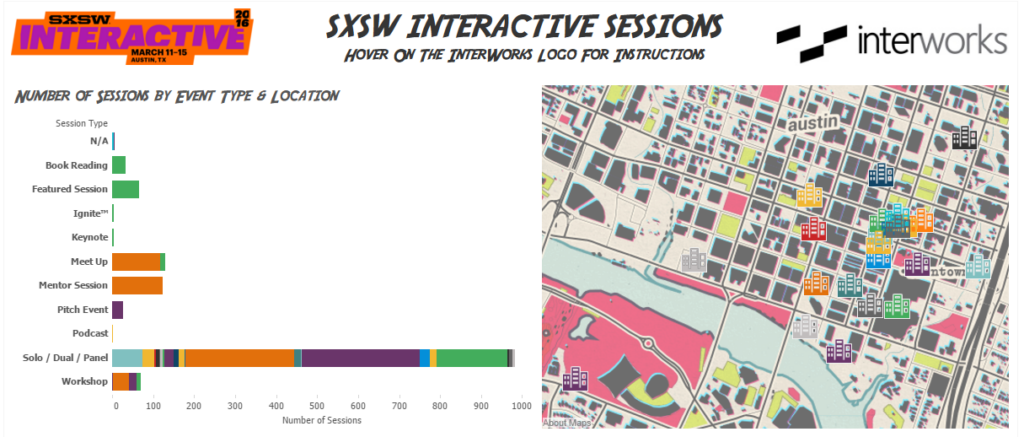
Every March, the Tech world descends upon Austin for the South By Southwest Interactive Conference. This year, SXSW is celebrating their 30th anniversary in a very big way with President Obama and the First Lady making an appearance in a pair of keynotes for the Interactive and Music festivals, respectively. While the ticket lottery has come […]
Quantified Office: Part 2 – The Sunrise Chart
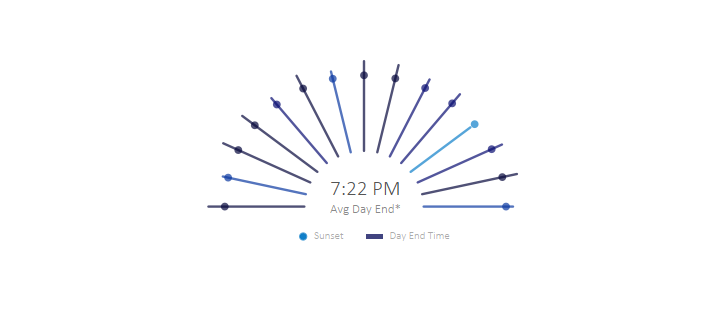
In Part 1 of this is series, I explained the general premise behind our Quantified Office dashboard. In this part of the series, I’ll explain why we chose a visualization type called the “sunrise chart” and show how we created it. I’m the first to admit that the sunrise chart in our dashboard doesn’t give us very valuable information. We wrapped bars around a […]
InterWorks EU Named Tableau’s 2015 Professional Services Partner of the Year (EMEA)

In true InterWorks fashion, our European brethren (InterWorks EU) recently earned the title of Tableau’s 2015 Professional Services Partner of the Year for Europe, Middle-East and Africa (EMEA)! Tableau bestowed this award and others during their EMEA Partner Summit in London last week. Considering the event hosted over 500 people representing perhaps one of Tableau’s […]