Star Wars: Box Office Battle
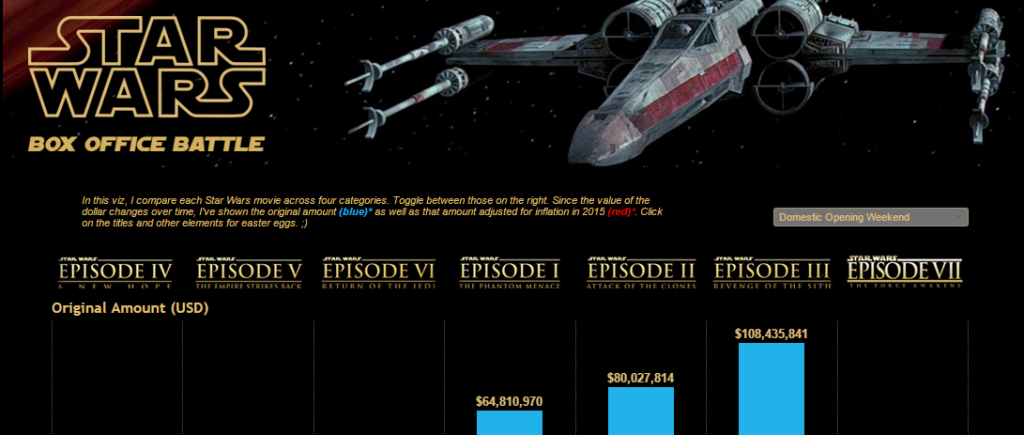
When historians look back on the 20th Century, it can be summed up best by four major milestones: The Allies win the war America puts a man on the moon The invention of the personal computer “Star Wars” All of these are truly remarkable feats, but I’ll be talking about only one of these today A […]
A New Way to Visualize KPIs in Tableau
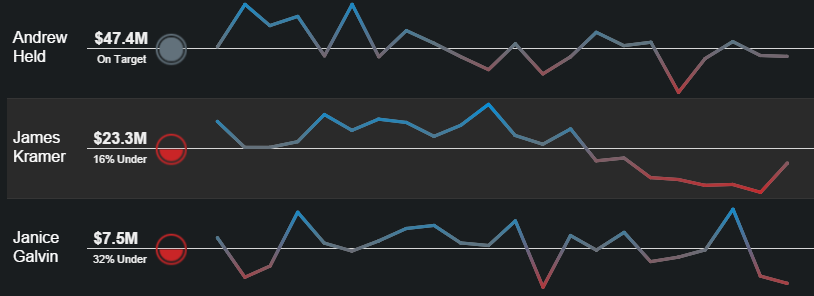
Key Performance Indicators are one of the most common things people need to display in a dashboard. This usually involves comparing current values or historical trends against a target value. Tableau makes it easy to show current values and trends in one dashboard, but this requires two separate views. In this post, I’ll describe a […]
The Tableau Performance Checklist: Rendering – Minimize Image & Shape File Sizes
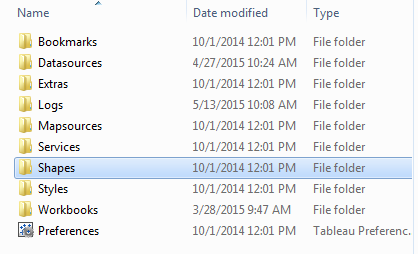
Let’s take a look at our next guideline from the Rendering category: “Minimize the file size of any images or custom shapes where possible. As a general rule of thumb, keep images under 50kb.“ Let’s get started, shall we? Images & Custom Shapes In regards to rendering, images and custom shapes, you should really focus […]
Using the Data Interpreter in Tableau 9.2 to Recognize Sub Tables
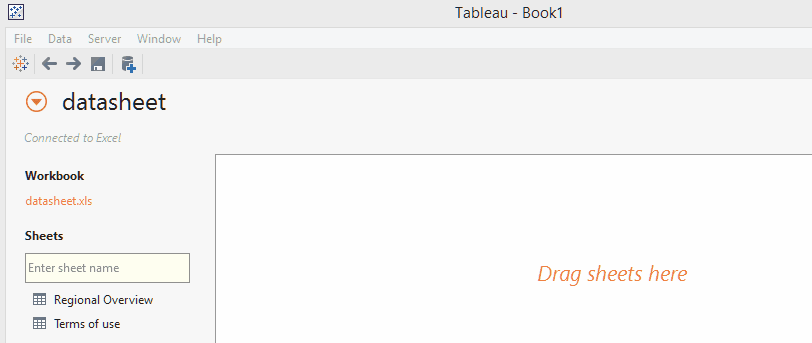
I recently found a data set that was perfect for testing out the new Data Interpreter in Tableau 9.2. While discussions about Syrian refugees were ramping up, I sought out data about the situation, which led me to the UNHCR page dedicated to this crisis. Using the Excel download option at the top results in […]
Live Viz Easy with Tableau 9.2
At the beginning of my career with InterWorks, I knew only a fraction of what I do now about the Tableau Desktop tool. One of my very first posts mentioned the new Mac connector in 8.2. Upon the release of Tableau 9.2, I’m back to preview my favorite enhancements in Tableau Desktop! Connecting to Data It […]
Tableau Driver’s Ed: The Role of IT – Operations

In the previous article on Tableau Drive, we explored the necessary partnership between the leadership of the business and IT that must be forged to successfully implement the Tableau Drive methodology. We briefly visited the role of each group in this partnership. Today, we’ll more fully explore what those responsibilities are for IT and, in […]
Performing a Database Restore with Veeam Configuration Backup
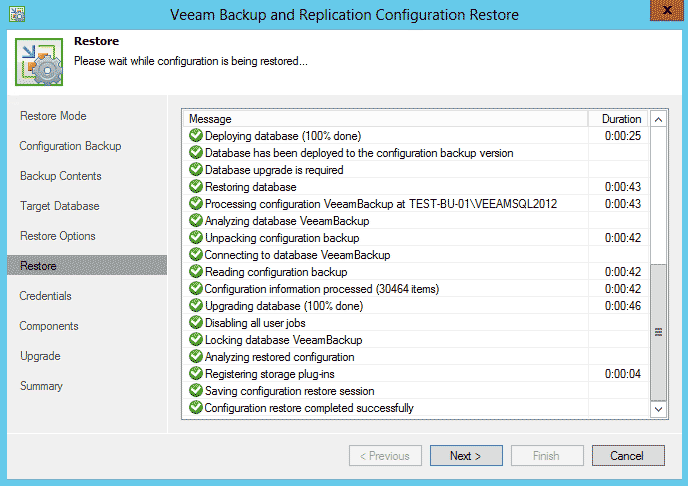
When utilizing backup products, one consideration many businesses forget to address is to make sure that the backup configuration is documented or that there is a backup for the configuration. This shortcoming, observed by many backup products, has been addressed by Veeam by providing a feature called Configuration Backup. This article shows how to perform a […]
Adobe MAX 2015 Rewind

We go to a lot of conferences here at InterWorks. From the Tableau Conference and other data conferences across the globe to Dell World and VMworld, we cover all the bases. As a full-spectrum IT and data company, it only makes sense to have a presence at events like these; it comes with the territory. But […]
InterWorks Claims Highest Spot Yet on Tulsa’s Fastest Growing Companies List

You know the drill people. Just recently, InterWorks made another award list: Tulsa’s Fastest Growing Companies (formerly Tulsa’s Fast 40)! The list, put together by The Journal Record, honors 40 of the Tulsa area’s fastest-growing private businesses for 2015. Much like the OKC Metro 50, Tulsa’s Fastest Growing Companies list uses two-year revenue growth to […]
ESXi 6 Deprecated VMFS Volume Found on Host
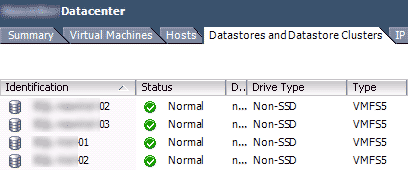
After performing a reboot on an ESXi 6.0 server, and in some cases upgrading to version 6.0, I noticed the following error for a few of my ESXi hosts: “Deprecated VMFS volume(s) found on the host. Please consider upgrading volume(s) to the latest version” I proceeded to check the volumes and noticed that everything was […]
