Questions from Tableau Training: Business Day Calculations
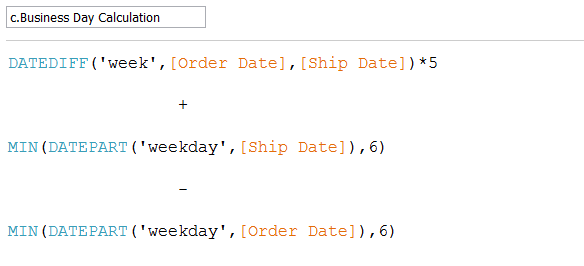
A common question that often comes up in trainings is: “How do I run a ‘difference between two dates’ calculation only considering business days?” In order to focus on business days, we need to adjust our calculated field to define what a “Business Day” is. First, we need to be aware that Tableau gives each weekday […]
The Tableau Performance Checklist: Rendering – Limit Text Tables With Lots of Marks

Let’s take a look at the next item on our rending category. “Limit the use of detailed text tables with lots of marks.“ Ah yes, the fabled Text Table. Mark Counts Let’s start this discussion by reviewing mark counts. We covered this in the previous Rendering article in the Tableau Performance Checklist series, but it […]
TCU @ Oklahoma State by the Numbers

TCU plays against Oklahoma State tomorrow, and few are giving OSU a chance in the matchup. OSU is surprisingly strong at home and TCU appears to have some weaknesses on the road that many are ignoring. See how both teams stack up thanks to some quick work in Tableau.
Recovery of a Virtual Machine Using the DataGravity Discovery Series
We continue to be a very satisfied customer and partner of DataGravity. Just this week, we were saved in a big way by our DataGravity Discovery Series storage array. First off, I’ll provide a little context around the issue. The Issue: Virtual Machines Offline We upgraded our production environment to the latest build of VMware […]
Login Issue When Connecting to Tableau Server from Tableau Desktop

Today, I ran into a Tableau issue that I couldn’t solve through googling. Using SAML and attempting to connect to Tableau Server from Tableau Desktop, I wasn’t given the option to enter a username and password. Instead, I received this message containing “errorCode=16:” Here’s What Happened I was signed in as a different user (non-publisher) in […]
Tableau Conference 2015 Told in Selfies

Tableau Conference 2015 officially ended a little over a week ago, and I’m already missing Vegas and all my fellow InterWorkers. Fortunately, I took plenty of pictures to relive the conference in all its glory. If you know me, then you know that my selfie game is on fleek. Also, I’m pretty much everywhere. So, […]
A Look Back at VMworld 2015

Back in early September, some of the InterWorks IT team and I were fortunate enough to attend VMworld 2015 in San Francisco, CA. For those of you who don’t know, VMworld is VMware’s annual conference on virtualization. This year, 35,000 people attended the six-day event which absorbed the once separate Partner Conference. We’ve been pretty busy since […]
The Tableau Performance Checklist: Rendering – Avoid High Mark Counts

The first item in the Rendering category is: “Avoid high mark counts. More marks = longer rendering time.“ Let’s jump right in on this one. Mark Counts Marks are the points, plots or symbols on your visualization. They can be the bars in your horizontal bar graph or the points in your line graph. Each […]
A Quick Recap of Tableau Conference 2015

Just a few days ago, Tableau Conference 2015 came to a close. 🙁 It was sad to see it end, but we had to return the real world sometime, right? Well, here we are. Now that we’ve settled back in, we can finally put the conference into perspective and give it a nice little recap. If […]
Exporting Tableau Dashboards to PowerPoint
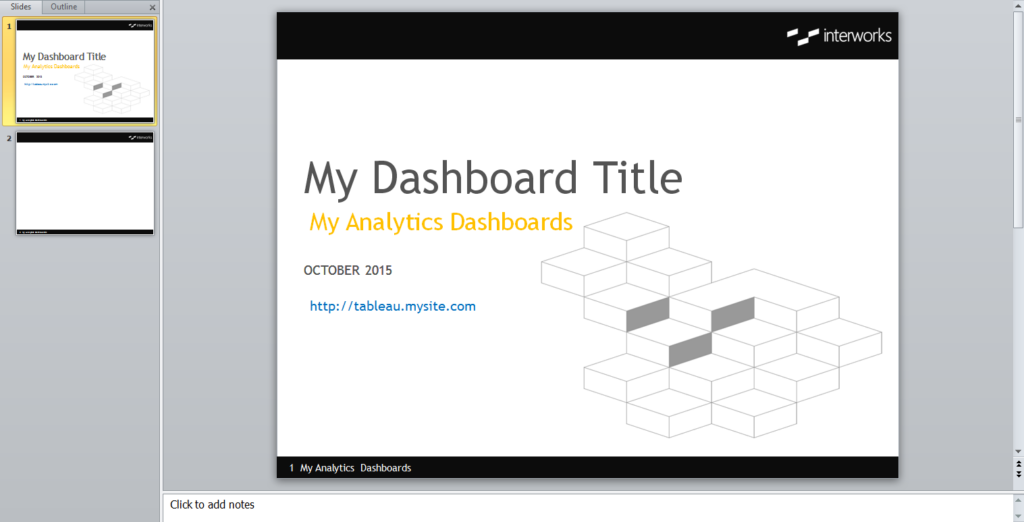
As Tableau Developers, we hate to see our work flattened and shoved into a PowerPoint file. We love to see our work displayed in it’s fullest, greatest ways – full of filters, parameters and tooltips for our users to play around with. Occasionally, though, we have a few stubborn users who want to see the data in […]