PYD07 – Cole Nussbaumer Knaflic – Consultant and Storyteller

Cole Nussbaumer Knaflic graciously takes some take away from her family to talk with Dan Murray about telling better stories through data and how the way in which that data is presented matters. Grab her new book at storytellingwithdata.com/book/.
Open Data Viz: Summer Fun in Washington, D.C.
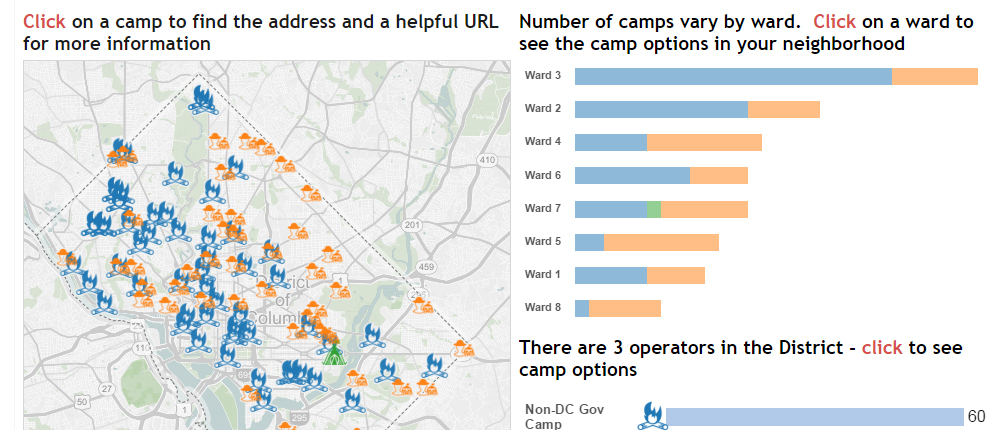
Campers have a lot of options today! It’s not just a trip to the woods anymore but a plethora of special activities and camps to choose from. I can imagine the arduous process of finding something kids like that’s also close to your home. In Washington, D.C., there are over 100 camps operated by the […]
Tableau 10 Beta: First Impressions
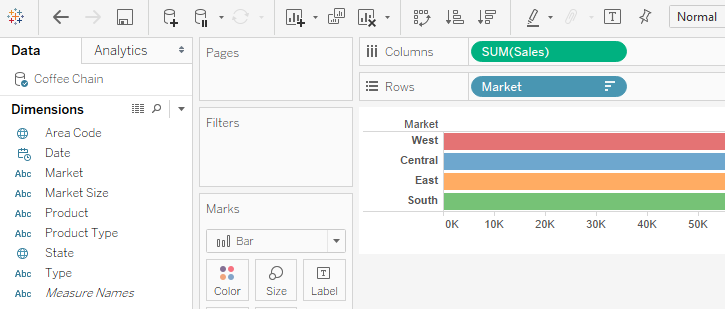
I jumped at the chance to play with the first beta of Tableau 10. The theme I recognize the most centers around one thing – less clicks to get to answers more quickly. Tableau got a makeover The world of clean visualizations Connect to more data Filter across data sets Click to create new areas Cross […]
PYD06 – Lawrence Corr – Data Warehouse Designer and Author

Lawrence Corr joins Tim Costello on location to talk about his history in the sweets industry, adding more and more w’s and how #modelstorming can make data modeling creative, collaborative and – dare we say – fun! You can find Mr. Corr’s book on Amazon – US or UK.
Tableau Deep Dive: Parameters – Filtering – Top N
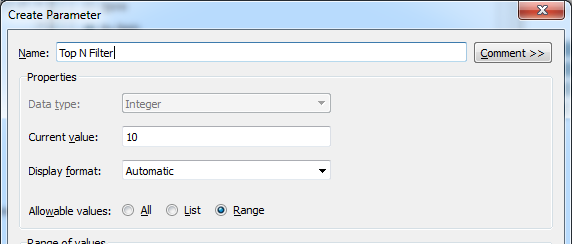
In part 1 of this Deep Dive exploration into parameters, we covered how to create a parameter as well as the four essential steps of using one. For part 2, we covered all of the parameter properties. Now, we’re going to talk about how to use parameters in your filters. The Top N Use Case […]
Tableau Deep Dive: Parameters – Parameter Properties
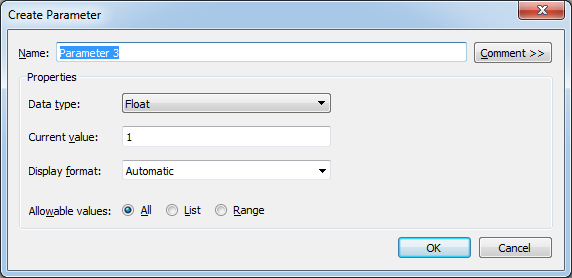
In this article, we’re going to go into detail on all of the different properties in the Create Parameter window. Parameter Properties The Create Parameter window looks like this: Let’s explore each of these parameter properties: Name The name of your parameter. This is how it will appear throughout the Tableau interface and within your […]
The Tableau Server tabcmd Download Archive
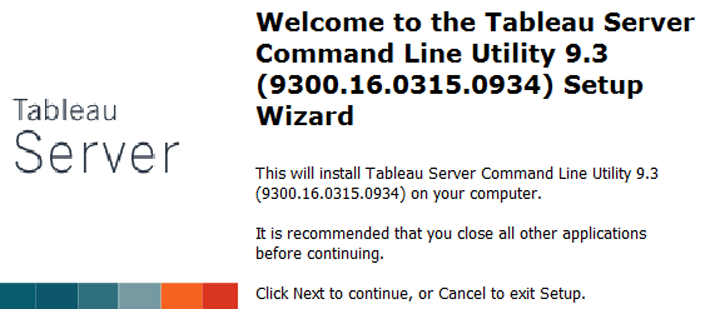
Tableau Server installs with a handy command-line utility for scripting common site administration tasks called tabcmd. To get the installer for this utility, the Tableau Server admin guide points you to the extras folder in your Tableau Server installation directory, e.g. C:Program FilesTableauTableau Server9.3extrasTabcmdInstaller.exe. While Tableau hosts these installer files on its website, there is no awesome list […]
Tableau Deep Dive: Parameters – Parameter Overview
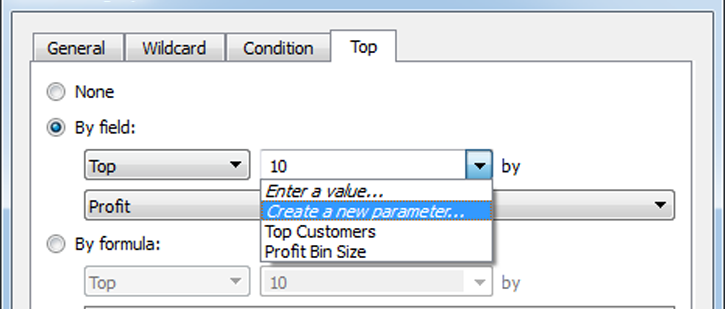
In this Tableau Deep Dive, I’m going to dig into parameters and some of the different places where you can use them. Parameters are values that users can change when interacting with a view. They add versatility to your visualizations. Within Tableau, wherever you are entering a constant value, there’s a great chance you can use […]
Open Data Viz: The NYC Restaurant Finder
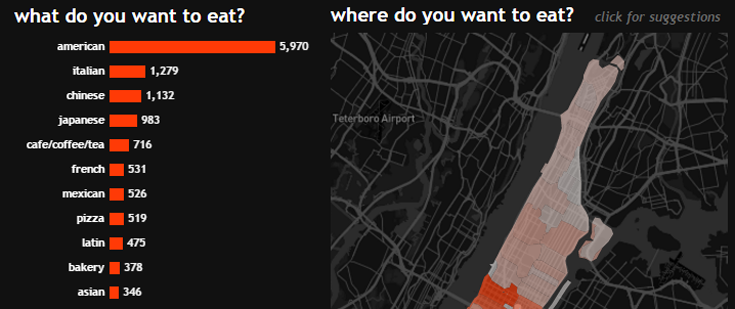
After seeing my colleague, Maureen, dive into NYC Open Data with posts on NYC Vehicle Crashes and Parking Tickets, I figured I should take a look around myself to see what other kinds of data the city has made public. Turns out there are more than 1300 data sets available on the site. After some digging, I […]
InterWorks Dubbed ‘Best IT Company in Oklahoma’ for Sixth Straight Year

We just keep crushing the 2010’s. For the sixth consecutive year, okc.BIZ named InterWorks the “Best IT Company in Oklahoma” as part of their annual Best of Business awards. The announcement came during the Best of Business awards banquet held in Oklahoma City on March 29. Our feelings on winning yet again? Ecstatic. We’d simply […]
