
When creating a data visualizations using U.S. weather data, I’m running into a problem. I have weather data in a dense grid from NOAA, but no way to filter individual states. Some data sources show the contiguous U.S. while others are sections of satellite coverage. None of these sources identify the states that I wanted to use in this dashboard telling the story of drought and flooding in TX, OK and CA. It’s quite the predicament, but there is a solution. With Alteryx, I can use the Spatial Match tool to assign state names to each point. This post talks about how to do that kind of reverse geocoding.
Data/Setup
I’ll begin by identifying the data sources I’m using. Input data in this case is from the Advanced Hydrologic Prediction Service, part of the National Weather Service (a similar data set can be found in this wind map, which uses a grid that extends beyond the coastlines). The state definitions I used are from the U.S. Census Bureau, which offers state shapefiles at different resolutions.
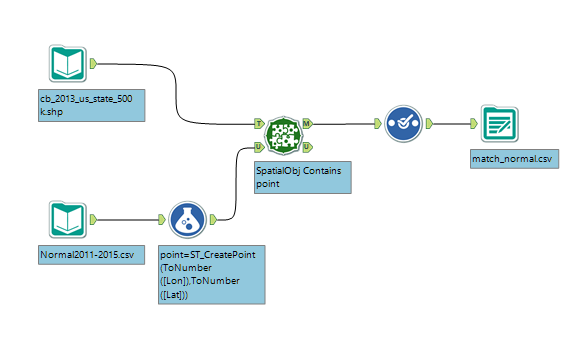
I fed these two data sources into the Alteryx Spatial Match tool as shown below:
How Alteryx Matches Points
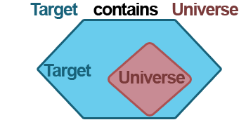
So, what exactly is going on here? For a foundational explanation, the Spatial Match help page in Alteryx does a great job of illustrating what is being matched using different options. In this example, we’re matching a point with a polygon so we can configure the Target as the state boundary from the census shapefile. The Universe is the range of all points in NOAA’s geographic grid. Think of it like this: The state borders are like a bullseye and the latitude/longitude points are like the places where darts hit the map. Here is how Alteryx illustrates it when we want to see if the target shape contains a certain point (or shape in some cases):
With that in mind, we have to do a simple conversion to translate two fields, Lat and Lon, into a single geographic point using a formula function like this:
ST_CreatePoint(ToNumber([Lon]),ToNumber([Lat]))
Longitude goes first because it’s looking for x,y coordinates. I used a Select tool to ignore fields like land area and redundant state identifiers to speed up the processing and reduce the output file size.
But Wait, There’s More!
This tool isn’t just limited to point matching or state boundaries. The same idea can be applied to counties, cities, ZIP or any other boundary defined in a shapefile. Alteryx can identify any combination of overlaps, treating each polygon (or point) as a sort of Venn diagram that is defined either by the shape itself or its bounding rectangle. Yet again, Alteryx provides a multi-faceted solution for our spatial analytics woes. For more information on this process, check out this tabular guide to behaviors in the Spatial Match tool.