The Tableau Performance Checklist series is designed to help you streamline your dashboard performance and Tableau Server configuration. Each post expands upon one item listed in the master Tableau Performance Checklist. As of 2024, you can find an updated Tableau Dashboard Performance Checklist here.
Let’s examine the following item on the checklist:
“Use calculated fields carefully. Think about the data type as you code the calculation. Number and Boolean > date > string calculations when it comes to performance.“
This is another item that can quickly get you into performance trouble if you don’t exercise caution. Let’s dive right in.
Calculated Fields in Tableau
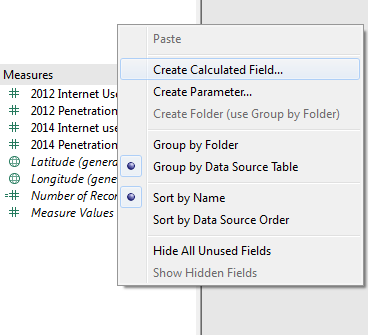
You can create a new field if the underlying data sources do not possess all of the fields you need by using calculations inside of Tableau Desktop. To do this, simply right-click on either the Dimensions or Measures pane and select Create Calculated Field (this may be under Create in the right-click menu, depending on your Tableau version and where you click in the field list):

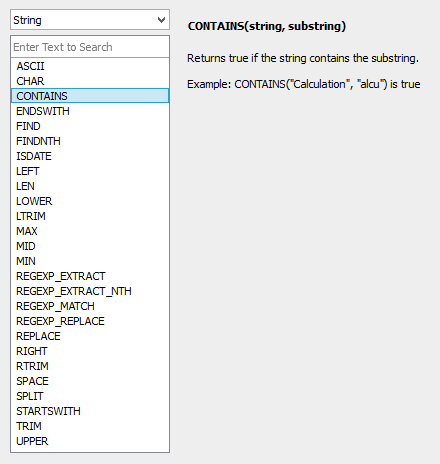
Tableau provides you with a massive list of functions that will aid you in creating your calculations. To help, these functions are divided into different categories. For instance, if you are working with fields that have the string data type, then you’ll need to consider all of the functions under the category of String.

Tableau will give you examples on how to use function in the side window simply by clicking on the function. In addition, we’ve written articles on all of the functions by category in our Tableau Essentials article series. Be sure to check it out if you’ve got any questions on how to use these functions or on any the fundamentals of Tableau Desktop in general.
Here’s the catch. Calculated fields should come with a warning – buyers beware. You can get yourself into a little bit of trouble if you don’t use some caution. Calculated fields give you a great deal of power in how you leverage your data inside of Tableau.
As we’ve already said in previous articles, “With great power comes great responsibility.”
Know Your Data Types
Calculated fields can be a limiting factor in performance. Tableau will help you in constructing your calculation by examining the syntax, but it cannot tell you if your beautiful calculation that you’ve just entered is going to tank your entire dashboard.
When considering how much risk calculations present to your visualization’s performance, a key factor is the data type of the fields you are using in your calculation. As the guideline states above, the faster calculations involve fields that have the data types of Boolean or numbers. Date data types are the slowest of all are strings.
The performance impact from different data types may be imperceptible on smaller data sets, but these differences become much more pronounced as the row count or number of fields in the calculation grows. If performance is a priority, consider ways to use a different data type to achieve the same calculated results. Here are some ideas:
- Replace if/then statements resulting in a string with one that results in a Boolean. For example, change:
IF [Field]="Compare" THEN "Match" ELSE "No Match" END
To:
[Field]="Compare"
Then, use aliases to change True to Match and False to No Match.
- If your if/then statement outputs three total results, consider changing the results to 1, 2 and 3 rather than something like Exceeded, Met and Did Not Exceed – this doesn’t always work, but it fits perfectly on occasion.
- Convert dates to integers (often with a calendar table in your database), allowing simple addition and subtraction instead of DATEDIFF() or DATEADD().
- In parameter-based calculations, use an integer as the parameter value and type a string value as the alias, minimizing the need for slower string comparisons.
When to Use Calculations
The best time to use calculations is when you cannot perform the calculation inside the native data source. This is a recurring theme in the Tableau Performance Checklist. Do as much as you can within the data sources and let Tableau focus on what it does best – creating interactive visualizations and dashboards. The underlying data source only needs to compile all of the data once to produce a visualization, but Tableau must query it again and again as each visualization is accessed or quick filter adjusted.
Mastering Best Practices
If you’re interested in becoming a Tableau Server guru, then learning these performance best practices is essential. Check back frequently as we add new posts and dive deeper into each point in the Tableau Performance Checklist.
Another great way to identify best practices is to leverage the insights offered by our Performance Analyzer, part of Workbook Tools for Tableau. It will examine all of your workbooks, worksheets, dashboards and data sources against a list of best practices to ensure that you’re using all the tips and tricks to guarantee your visualizations are moving at light speed.
As always, feel free to get in touch with us if you have any questions regarding performance or anything Tableau related! We’d be happy to help.


