
The Tableau Performance Checklist series is designed to help you streamline your dashboard performance and Tableau Server configuration. Each post expands upon one item listed in the master Tableau Performance Checklist. As of 2024, you can find an updated Tableau Dashboard Performance Checklist here.
We are onto our last category of the Tableau Performance Checklist, Dashboard Layout. For our next guideline:
“Limit the number of worksheets on a dashboard. If you have more than four visualizations on a dashboard, strongly reconsider.”
Let’s begin!
Dashboarding or Dash-boring
The allure of putting as much information on a single dashboard to create the Dashboard Supreme is very tempting for new users and Tableau Jedi alike. There are so many different possibilities and options in Tableau that it’s hard to draw the line from elegant to cluttered, informative to distracting and beautiful to darn-right ugly!
Everyone has their own personal opinion on the ways things look, but it’s up to you, the creator, to make it as simple, striking and informative as possible. All the while, you must concentrate on keeping the audience’s focus to delivering the answers and all within a reasonable timeframe.
If a viz takes too long to render, you could lose the audience. If a viz is too cluttered/badly designed, you don’t deliver the answers, If you have a viz that takes too long to render, and when it does, is illegible/messy, it may well be a total failure. Allow me to illustrate:
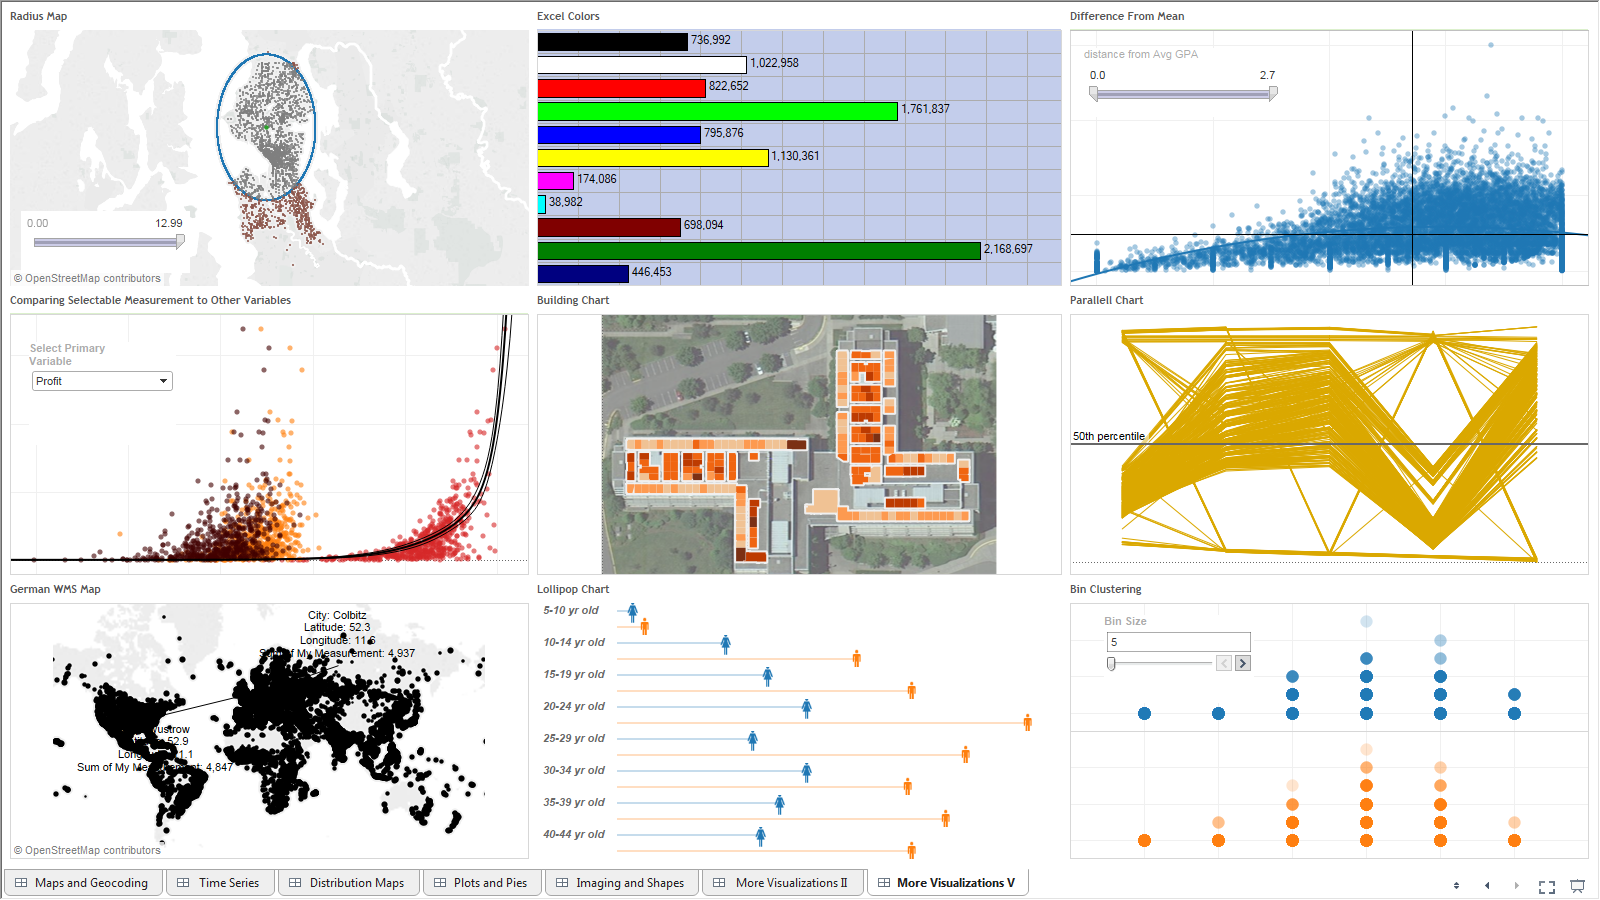
My head hurts just looking at this.
It’s not our aim in this checklist to give you advice on Tableau aesthetics, so let’s just say that it’s far more effective to tell one story very well than to tell a bunch of stories in a half-hearted manner. With each viz and with each dashboard, focus on which audience you are targeting within your report consumers and what story you want to tell.
Other than that little piece of advice, listen to your users. They’ll tell you which reports are speaking to them and which ones are useless. Take the feedback onboard and grow with it.
Behind the Scenes
With the subjective part out of the way, the primary reason to limit the number of worksheets on your dashboards is really about performance. Let’s take a very busy dashboard and run it through our Performance Analyzer, part of Workbook Tools for Tableau suite.
Let’s look at the load times of our sample dashboard above. Remember, we made this behemoth to be intentionally bad. For the love of Cthulhu, attempt this at home:
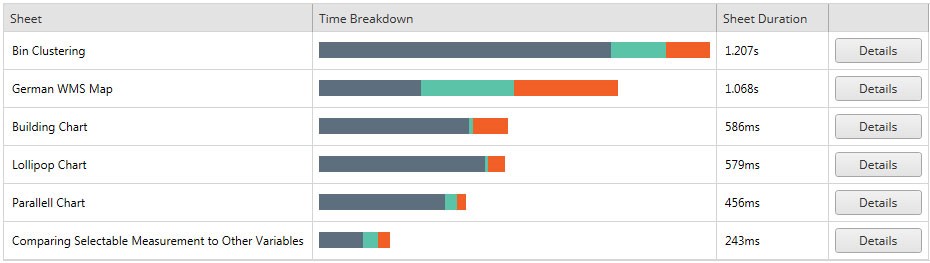
Each worksheet that is represented on the dashboard eats up time. The more worksheets, the more the report consumer has to wait for the dashboard to load, naturally. The above analysis gives you concrete numbers for that load time. While these individual times might not seem like a game changer, remember that there is a checklist of items that Tableau Desktop and Tableau Server must compile and display from the underlying data to the visualization.
Each one of those visualizations is an investment. The more you add, the more the end user will wait. Is each one worth the extra time that it will cost over the hundreds or thousands of times this dashboard is loaded?
The truth is, probably not.
Also consider the types of charts that are being represented on a dashboard. Different types of charts have different processing times due to the way the charts are built and render as well as the table calculations and number of axes that are contained within each of them. A bar chart is less process-intensive than a pareto chart for example. Just keep that in mind when finalizing the dashboards, especially if you feel the need to have more than four worksheets.
Portal Possibilities
Rather than overload your dashboards with an abundance of worksheets, you should instead consider creating an analytics portal (if you don’t already have one). This will allow you to group complementary dashboards together while keeping them efficient in loading and effective in conveying their story. There are a lot of different ways to create an analytics portal, but perhaps the easiest way is to use a content management solution. These are easily maintained by non-technical team members, are quick to customize and are versatile in their ability to integrate with other types of tools or applications.
For more information on how we implement Tableau Portals, visit our Portals for Tableau.
Mastering Best Practices
If you’re interested in becoming a Tableau Server guru, then learning these performance best practices is essential. Check back frequently as we add new posts and dive deeper into each point in the Tableau Performance Checklist.
Another great way to identify best practices is to leverage the insights offered by our Performance Analyzer, part of Workbook Tools for Tableau. It will examine all of your workbooks, worksheets, dashboards and data sources against a list of best practices to ensure that you’re using all the tips and tricks to guarantee your visualizations are moving at light speed.
As always, feel free to get in touch with us if you have any questions regarding performance or anything Tableau related! We’d be happy to help.