
The Tableau Performance Checklist series is designed to help you streamline your dashboard performance and Tableau Server configuration. Each post expands upon one item listed in the master Tableau Performance Checklist. As of 2024, you can find an updated Tableau Dashboard Performance Checklist here.
This post is about boosting Tableau’s performance through data selection. Let’s address the second performance enhancing idea in the Data section of the Tableau Performance Checklist:
“Bring in only the data needed for analysis. Consider adding a data source filter or using an extract. If using a join, minimize the number of joined tables.”
In this statement we actually see three recommendations: using a data source filter, creating an extract and joining fewer tables in our connection. Before we cover each of these in detail, let’s first discuss the general idea.
Doesn’t it make sense that Tableau won’t perform as well if we have it trying to crunch, manage and sort through massive amounts of superfluous data? It should be intuitive that the more data we’re connected to, the more resources Tableau has to spend on calculated fields, filters, etc. If we don’t actually need all of the data we’re connected to, then we’re actually wasting resources that could instead be put to use boosting performance.
Focus on User Performance
Forget about Tableau’s performance for a second though. What about ours as users? More data generally means more fields we have to sort through in the data window, our calculations also typically become more complicated, and we have to add a gazillion filters to keep out the data we don’t want in our views. Unnecessary data ultimately slows down both Tableau and the user.
It’s natural when we’re first creating a workbook to connect to as much data as possible because we’re not sure what we’ll need. However, once we do have an idea of what data we’ll actually be using, we should edit our connection to target only that data. We should also look into ways to enhance the performance of our connections. Let’s discuss some ways to do this using the three recommendations above.
Minimizing Joined Tables
First let’s look at reducing the number of joined tables we’re connected to. Linking multiple tables together in one data source can be extremely valuable, but it also comes with its drawbacks. For one, if the joins aren’t set up right, the data from the resulting query might be compiled incorrectly with errors such as duplications. Even if the data is compiled correctly, the number of rows being returned could be exponentially more than either table individually depending on the granularity of each table and the type of join.
Joining a table also brings in all of its fields unless otherwise specified. Therefore, every join we make introduces potential error into our data and inflates the number of fields and rows we have to sort through when creating our visuals. If these tables contain data that is actually being used in our analysis, then the benefits might outweigh the costs.
However, if after crafting our analysis we don’t end up using any data from some of those joined tables, we should edit the connection to remove them. Even if it doesn’t produce significant gains in performance, it will definitely make it easier on the user when trying to make sense of all the dimensions and measures we’re connecting to.
Just for the sake of example, I created two tables in Excel that mirrored what I had seen at a client site recently, only mine are much smaller and simpler. One table is an inventory table with almost 170 rows, which indicates the inventory volumes for three products at four stores twice a day over a week. The other table is an orders tables with about 80 rows, representing the orders received during that week. If I try to join these two tables on their store number as in figure 1, my query returns over 3,300 results. Even by joining on additional fields, I can only whittle my results down to 1,120 rows. Examining the data reveals that I’ll also likely have issues with my calculations because of the way these tables have been compiled.
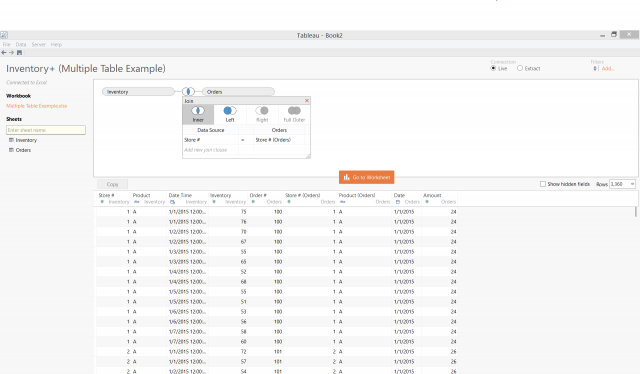
Figure 1: Trying to join tables.
The client I was working with was running into the same issues, only on a much larger scale as their inventory table alone had almost 200 million rows in it. Performance was really bad, and the extract took overnight to refresh. When I looked at the template worksheets though, none of them were using data from both tables. Once we duplicated the data source and dropped the unnecessary table from each one, extract refreshes went from overnight to a few minutes.
Adding Data Source Filters
The next recommendation we’ll cover is using data source filters. Data source filters are used primarily in two ways. One is using a data source filter as a context filter, and the other is for the purpose of filtering an extract so that it is smaller and takes less time to refresh.
Context filters are a quasi-data source filter that will only boost performance in certain cases, usually when there are lots of filters and data being used in a view. Traditional filters in Tableau work independently of each other, meaning that that each filter is evaluated for every row in the data set, not just the rows that have made it through the previous filters.
Context filters, however, are executed before traditional filters so that each traditional filter only gets evaluated for the rows that pass through the context filter. The context filter creates a flat table of just the values that pass through it, and then the traditional filters are evaluated against the rows in that flat table.
Still, context filters come with the upfront performance cost of building the flat table. In figures 2 and 3, I’ve analyzed the performance of two workbooks using the Performance Analyzer from our Workbook Tools for Tableau.
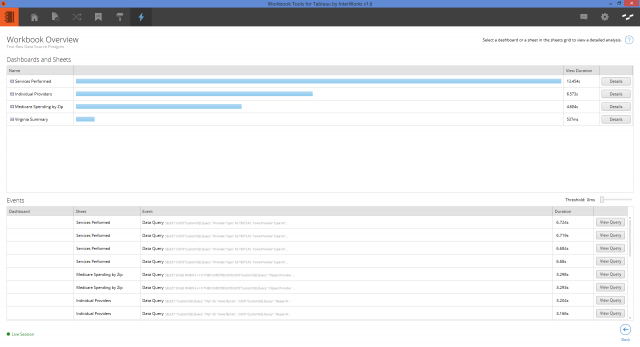
Figure 2: Performance without a context filter.
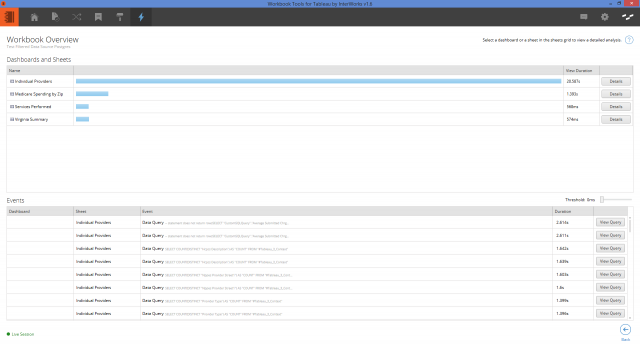
Figure 3: Performance with a context filter.
The workbooks are identical except that one is using a global context filter. Notice the extra time it took loading the initial view of the workbook with the context filter. But that after that, the performance was much better.
In this example, the faster load times of the subsequent views doesn’t really offset the initial time needed to build the flat table. That said, this was a relatively small data set with few filters. The more data and filters you used, the more sensible using a context filter becomes.
Use Extracts, but Limit Size
Another use of a data source filter is to limit the size and refresh time of an extract. When you generally create an extract, it contains all of the data which can be time consuming to refresh. If you know though that you’re only using a subset of the data, then use a data source filter so that the extract only contains what you’re needing. The filtered extract will require less resources in terms of memory, and its refresh times will be reduce quasi-proportionally to the reduction in data.
Finally, when it comes to improving Tableau’s performance, using an extract is king. Not only is this because extracts are stored in a structure that is easier for Tableau to query and access, but also because deterministic calculations are stored as real values. This means that if I have a calculated field in an extract that Tableau knows won’t change, rather than performing the calculation post-query, Tableau actually saves the values as actual data so that no calculation computing is necessary.
Of course, the primary drawback to using extracts is that the data isn’t in real time. With scheduled tasks though, extracts can be refreshed automatically every 15 minutes. So, if you’re suffering from performance issues and you can stomach 15-minute-old data, using an extract is your best option.
The Final Verdict
When it comes to your data, don’t be greedy! Use only what you need; no more, no less. Get rid of joined tables containing data that isn’t actually being used. Consider using data source filters, either as context filters or to filter an extract. And wherever possible, use an extract! Of course, there are many more tips you can use such as hiding unused dimensions and pre-aggregating a data source. Look for more details on these tips, along with many others, in future additions to this series!
Mastering Best Practices
If you’re interested in becoming a Tableau Server guru, then learning these performance best practices is essential. Check back frequently as we add new posts and dive deeper into each point in the Tableau Performance Checklist.
Another great way to identify best practices is to leverage the insights offered by our Performance Analyzer, part of Workbook Tools for Tableau. It will examine all of your workbooks, worksheets, dashboards and data sources against a list of best practices to ensure that you’re using all the tips and tricks to guarantee your visualizations are moving at light speed.
As always, feel free to get in touch with us if you have any questions regarding performance or anything Tableau related! We’d be happy to help.