The Tableau Performance Checklist: Rendering – Avoid High Mark Counts

Data

The Tableau Performance Checklist: Rendering – Avoid High Mark Counts

The Tableau Performance Checklist series is designed to help you streamline your dashboard performance and Tableau Server configuration. Each post expands upon one item listed in the master Tableau Performance Checklist.

The first item in the Rendering category is:

Avoid high mark counts. More marks = longer rendering time.

Let’s jump right in on this one.

Mark Counts

Marks are the points, plots or symbols on your visualization. They can be the bars in your horizontal bar graph or the points in your line graph. Each specific data point is a mark that must be created and positioned on the visualization by Tableau before the report can be rendered.

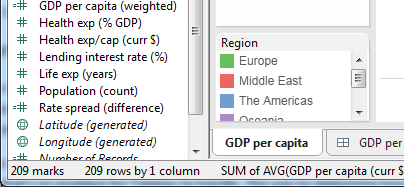
Most charts will not have a large number of marks. The average visualization might have a few hundred or less, which is no problem for Tableau to handle. The easiest way to determine how many marks you have on your visualization is to look at your worksheet inside of Tableau Desktop. In the bottom left-hand corner is the number of marks on that particular worksheet:

Marks

More marks mean more work for Tableau during rendering. 

Less Is More

In many situations, it’s possible to reduce the number of marks without changing the story, purpose or point. The way to reduce the number of marks that your worksheet has to render is to remember that in some cases, “less is more.”  If you have three 300,000 data points, you do not necessarily need to plot all of them on a single worksheet. Rather, look to filter them or break out the results into different worksheets or views for better visibility into the data.  

There are a lot of other ways you can use the interactivity of Tableau to allow the user to drill down to the information they are most interested in seeing without overloading a single worksheet with too many marks. Overloading a worksheet to an extreme will simply lose the audience as overlapping and merging marks may make the visualization difficult to decipher, thus obscuring the message you are trying to portray to the consumer.

Mastering Best Practices

If you’re interested in becoming a Tableau Server guru, then learning these performance best practices is essential. Check back frequently as we add new posts and dive deeper into each point in the Tableau Performance Checklist.

Another great way to identify best practices is to leverage the insights offered by our Performance Analyzer, part of Workbook Tools for Tableau. It will examine all of your workbooks, worksheets, dashboards and data sources against a list of best practices to ensure that you’re using all the tips and tricks to guarantee your visualizations are moving at light speed.

As always, feel free to get in touch with us if you have any questions regarding performance or anything Tableau related! We’d be happy to help.

Contact Us!

Want More The Tableau Performance Checklist

  1. The Tableau Performance Checklist
  2. The Tableau Performance Checklist: Data – Keep Analysis Simple
  3. The Tableau Performance Checklist: Data – Bring in Only Needed Data
  4. The Tableau Performance Checklist: Data – Use ‘Describe’ to Explore
  5. The Tableau Performance Checklist: Data – Remove Unused Columns from Extracts
  6. The Tableau Performance Checklist: Data – Use One TDS File
  7. The Tableau Performance Checklist: Data – Use Extracts
  8. The Tableau Performance Checklist: Filtering – Minimize Quick Filters
  9. The Tableau Performance Checklist: Filtering – Avoid ‘Only Relevant Values’ in Quick Filters
  10. The Tableau Performance Checklist: Filtering – Avoid High-Cardinality Quick Filters
  11. The Tableau Performance Checklist: Filtering – Avoid Quick Filters That Drive Context Filters
  12. The Tableau Performance Checklist: Filtering – Keep Range Quick Filters Simple
  13. The Tableau Performance Checklist: Filtering – Use Dashboard Filter Actions
  14. The Tableau Performance Checklist: Filtering – Don’t Be Lazy with User Filters
  15. The Tableau Performance Checklist: Custom SQL – Limit in Live Connections
  16. The Tableau Performance Checklist: Custom SQL – Avoid Parameters
  17. The Tableau Performance Checklist: Custom SQL – Watch for Useless Clauses
  18. The Tableau Performance Checklist: Calculations – Use Calculated Fields Carefully
  19. The Tableau Performance Checklist: Calculations – Limit Blended Calculations
  20. The Tableau Performance Checklist: Calculations – Avoid Row-Level Calculations Involving Parameters
  21. The Tableau Performance Checklist: Rendering – Avoid High Mark Counts
  22. The Tableau Performance Checklist: Rendering – Limit Text Tables With Lots of Marks
  23. The Tableau Performance Checklist: Rendering – Minimize Image & Shape File Sizes
  24. The Tableau Performance Checklist: Rendering – Use Transparent Background PNGs
  25. The Tableau Performance Checklist: Local Computations – Server Performance
  26. The Tableau Performance Checklist: Local Computations – Table Calculations
  27. The Tableau Performance Checklist: Dashboard Layout – Limit Number of Worksheets
  28. The Tableau Performance Checklist: Dashboard Layout – Fix Dashboard Size

More About the Author

Robert Curtis

Managing Director, APAC
Building Solutions with InterWorks at Corinium’s Data Architecture Conference in Melbourne InterWorks was a proud sponsor of the Data Architecture Conference hosted by Corinium in Melbourne on 21 and 22 June 2023. Hundreds of ...
Virtual Event Recap: Deep Dive of Tableau Parameters For our June Lunch and Learn, we did a deep dive on parameters for our friends across Australia and Singapore. Tableau is the premier ...

See more from this author →

InterWorks uses cookies to allow us to better understand how the site is used. By continuing to use this site, you consent to this policy. Review Policy OK

×

Interworks GmbH
Ratinger Straße 9
40213 Düsseldorf
Germany
Geschäftsführer: Mel Stephenson

Kontaktaufnahme: markus@interworks.eu
Telefon: +49 (0)211 5408 5301

Amtsgericht Düsseldorf HRB 79752
UstldNr: DE 313 353 072

×

Love our blog? You should see our emails. Sign up for our newsletter!