I have been using Tableau since version 4, initially as a Tableau customer. One of the first things I wanted was to be able to see my data on the move. I didn’t want to see everything, just the basics, a list of green ticks showing me everything was OK back in the office, or the ability to interrogate if not. Tableau has come on a long way since v4 and there are many bespoke interactive features for mobile / iPad. The purpose of this article is to point you towards best practice when designing a mobile dashboard rather than listing out the features. Please note I am focusing on Tableau on your mobile rather than a tablet (if you use a phone with a screen that is somewhere in between mobile & tablet then I can’t help you …. and you probably look like an 80s yuppie when you are making calls). Tableau has the ability to size automatically but this won’t usually help you when it comes to mobile screens as the result will be squashed vizzes and missing text. I was asked once if Tableau would re-organise your dashboard automatically for mobile and the current v9 answer is ‘no, you would need to build a second dashboard’ (which is no bad thing). If you consider the amount of time taken to obtain, collate, clean and validate your data before dashboarding I believe that as a dashboard designer you have a responsibility to make the dashboard look as good as possible, only that way do you do justice to your team (and yourself). Dashboarding in Tableau probably represents about 5% of the total project duration but that is all the end user sees so it is worth the bit of extra effort to create a dashboard tailored for mobile. If you are reading this on a desktop / laptop it may be a good idea to open the dashboard below on your mobile to check out the interface as you go: http://goo.gl/q5HmmW
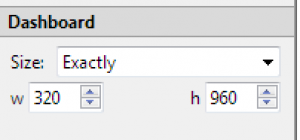
Tip 1: Design your mobile dashboard for the smallest screen size you will want to use. Create the dashboard 1 worksheet wide with the ability to scroll if necessary rather than trying to tile worksheets.
& here’s how each of the tips are implemented:
Tip 2: Include an icon to go between mobile and full dashboard. This is done as follows 1: In a new worksheet create a calculated field called [Go to full] with the content ‘Go To’ or similar. 2: Set the mark type to Shape and put the new field in the Shape Dropzone, customise the shape. 3: Put your new worksheet in your dashboard and create an action filter. 4: Set the current sheet to be the Source Sheet and select the new worksheet as a source 5: Set the destination dashboard as the Target sheet and leave all sheets selected 6: Run Action on Select, clearing selection will ‘Show All Values’ 7: Target Filters = ‘Selected Fields’ but leave the list blank, this will transport you to the other dashboard without applying any filters. Tip 3: Drag a horizontal layout container on to your dashboard and put all your quick filters in there. Make sure you select a dropdown option on the quick filter to minimise the space. Tip 4: Use a hierarchy and drill option to allow the users to expand the view as necessary. 1: Create a new Calculated Field called [drill] and add the content ‘drill’ 2: Use the ctrl key to multi select your top level field, detail level field and [drill], right click and create a hierarchy. Arrange the hierarchy so that drill is in the middle. 3: Go to Analysis > Table Layout > Advanced and set the Maximum levels of row labels to 2, set the maximum levels of horizontal row labels to 1. This will rotate the high level field labels when you drill down. When you test the operation of this on a mobile it works really nicely through the tooltip menu, it also allows you to drill up in the same way. Tip 5: You can add the labels on the marks card and then set them to appear when selected (rather than all the time). Make sure you switch off the tooltips (Worksheet > Tooltip…) Tip 6a: To create a faux-scrollbar drag a text box on to the far right of your dashboard, from there you can format it, use either a border or fill depending on the look / feel of your dashboard. Tip 6b: The point of a dashboard is to get the relevant information in one place, which is tricky on a small screen. By allowing your audience to show / hide panels you can give them the best chance of fitting what they want on the screen. 1: Create a new worksheet (called Map Title in this case) 2: Create a new calculated field called [Map] containing the content ‘Map’. 3. Change the mark type to Shape, drop the [Map] field in to shape and change it to a down arrow. 4: Add [Map] to rows and hide the field labels. 5: Repeat steps 1 – 4 for your other sheets (Timeline in this case) 6: Drag a vertical layout container on to your dashboard and add all the worksheets you want to show / hide in to it. (I have added my high level sheet as well to give it room to expand when drilling). 7: Add your new ‘title’ worksheets to the dashboard. I have added these ones in a horizontal layout container next to a blank for alignment. 8: Create an action filter where the source sheet is your ‘title’ and the target is the viz you want to hide. Make sure you run on ‘select’ and ‘Exclude all values’ upon clearing the selection. Repeat this step for your other hide-able sheets. Thanks for reading, you now have the power of Tableau on your mobile & in your pocket.