
I’ve been a storm chaser since I was eight years old. My grandfather volunteered for the Perkins Civil Defense, and part of his duty was to sit on a hilltop anytime severe weather came into the area. He let me tag along, and I’ve been hooked ever since.
After many years chasing tornadoes on the ground as a hobby/adventure/public service, I got to chase professionally for KFOR-TV NBC in Oklahoma City. Mainly, I chased with Jim Gardner in Chopper 4. My first time in the helicopter, we tracked and broadcasted a tornado in Western Oklahoma. That was exciting! Nothing like being eye to eye with a tornado at 1000 feet off the ground.
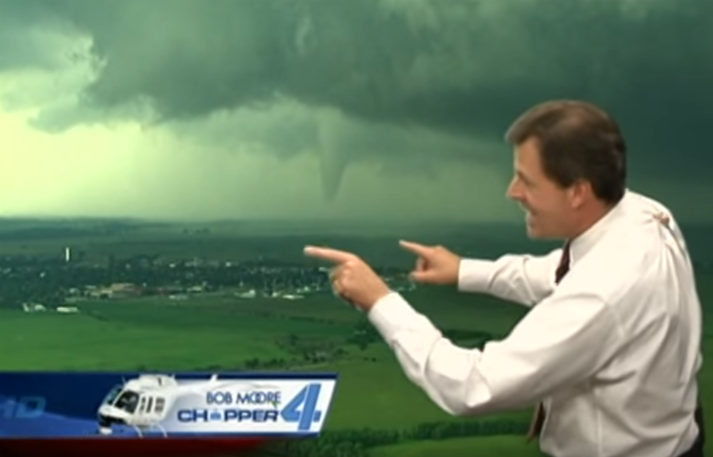
Even with the excitement, we never lost sight of our purpose. It’s not to shoot destruction and damage. Rather, it’s to warn the public about the threat and give them a clear path of the storm so they can make decisions to keep their families safe.
Naturally, being a weather nerd, I wanted to incorporate Tableau to ask weather questions. Obviously, looking at past weather data, we can find some really neat insights into things like tornado outbreaks, record temperatures and rainfall. But what if we wanted to see real-time weather? Thanks to Tableau’s mapping capabilities, we can use WMS (Web Map Service) servers to help us map out real-time weather in the United States.
Creating the Map in Tableau
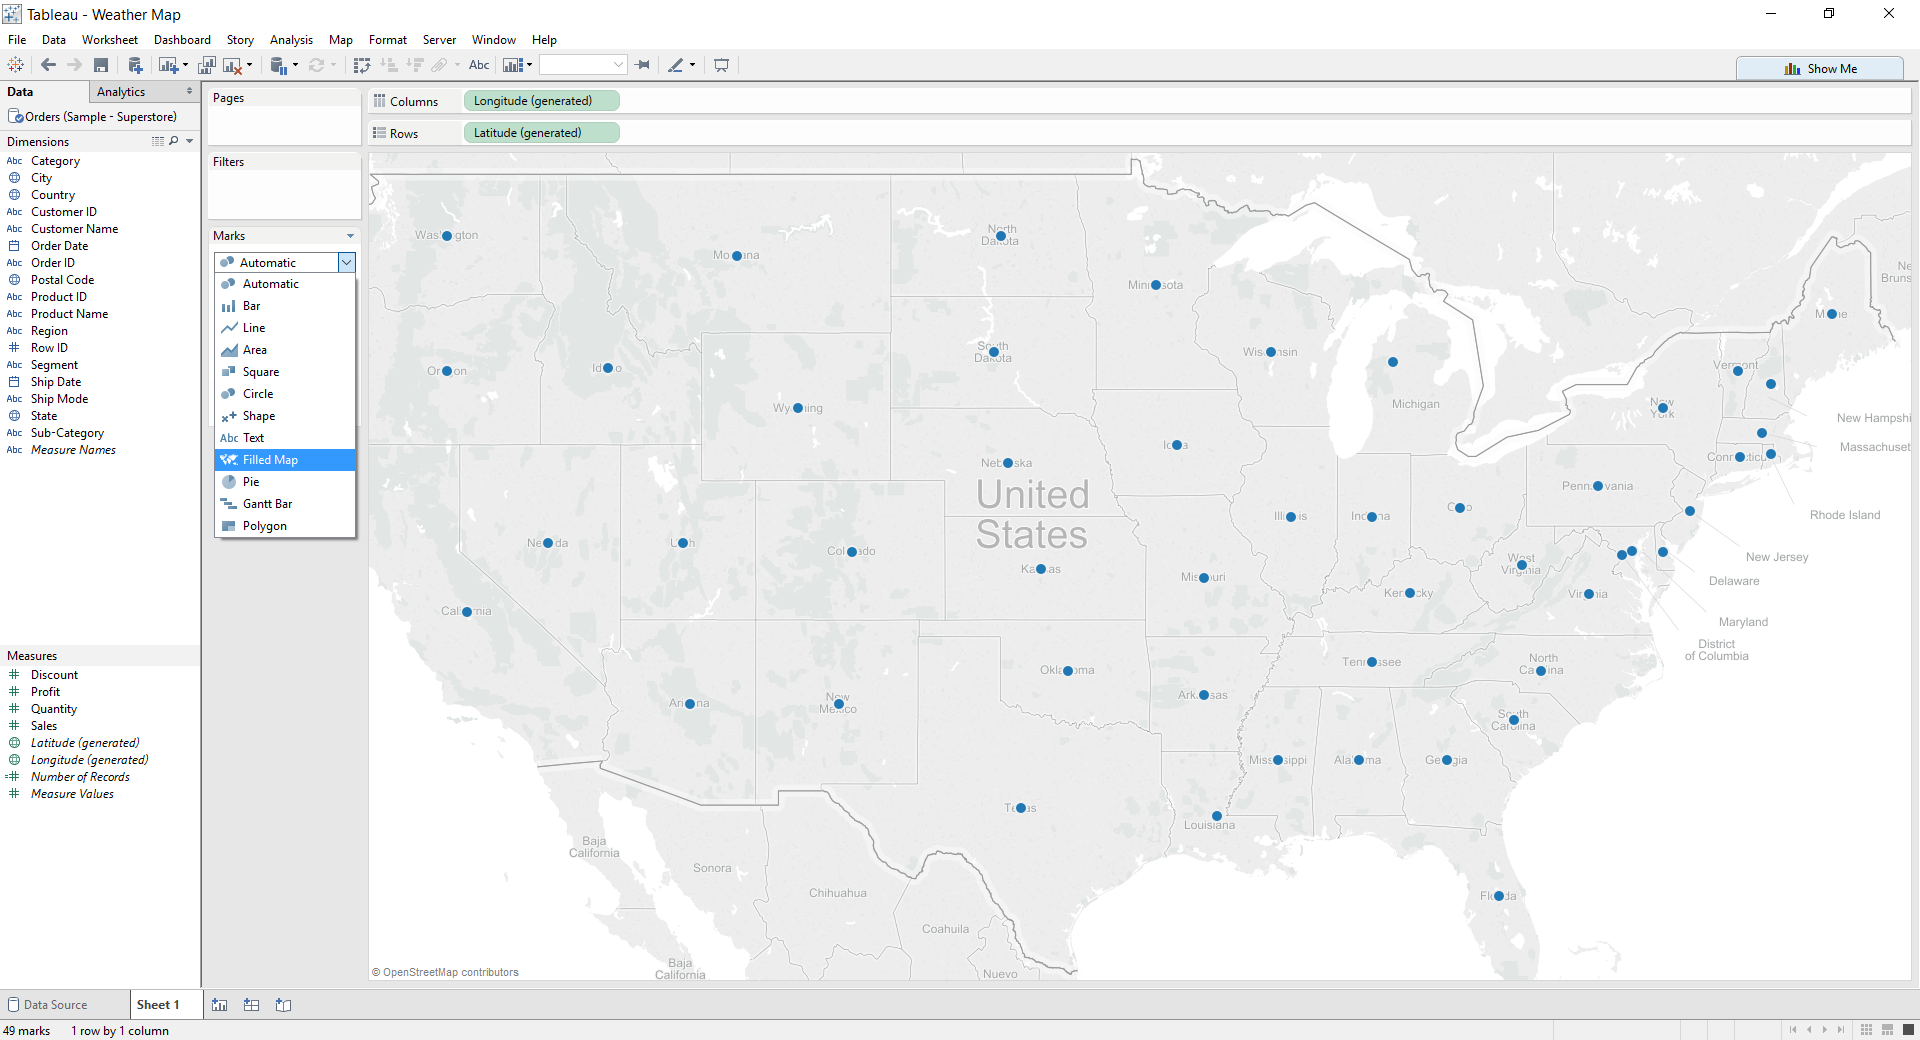
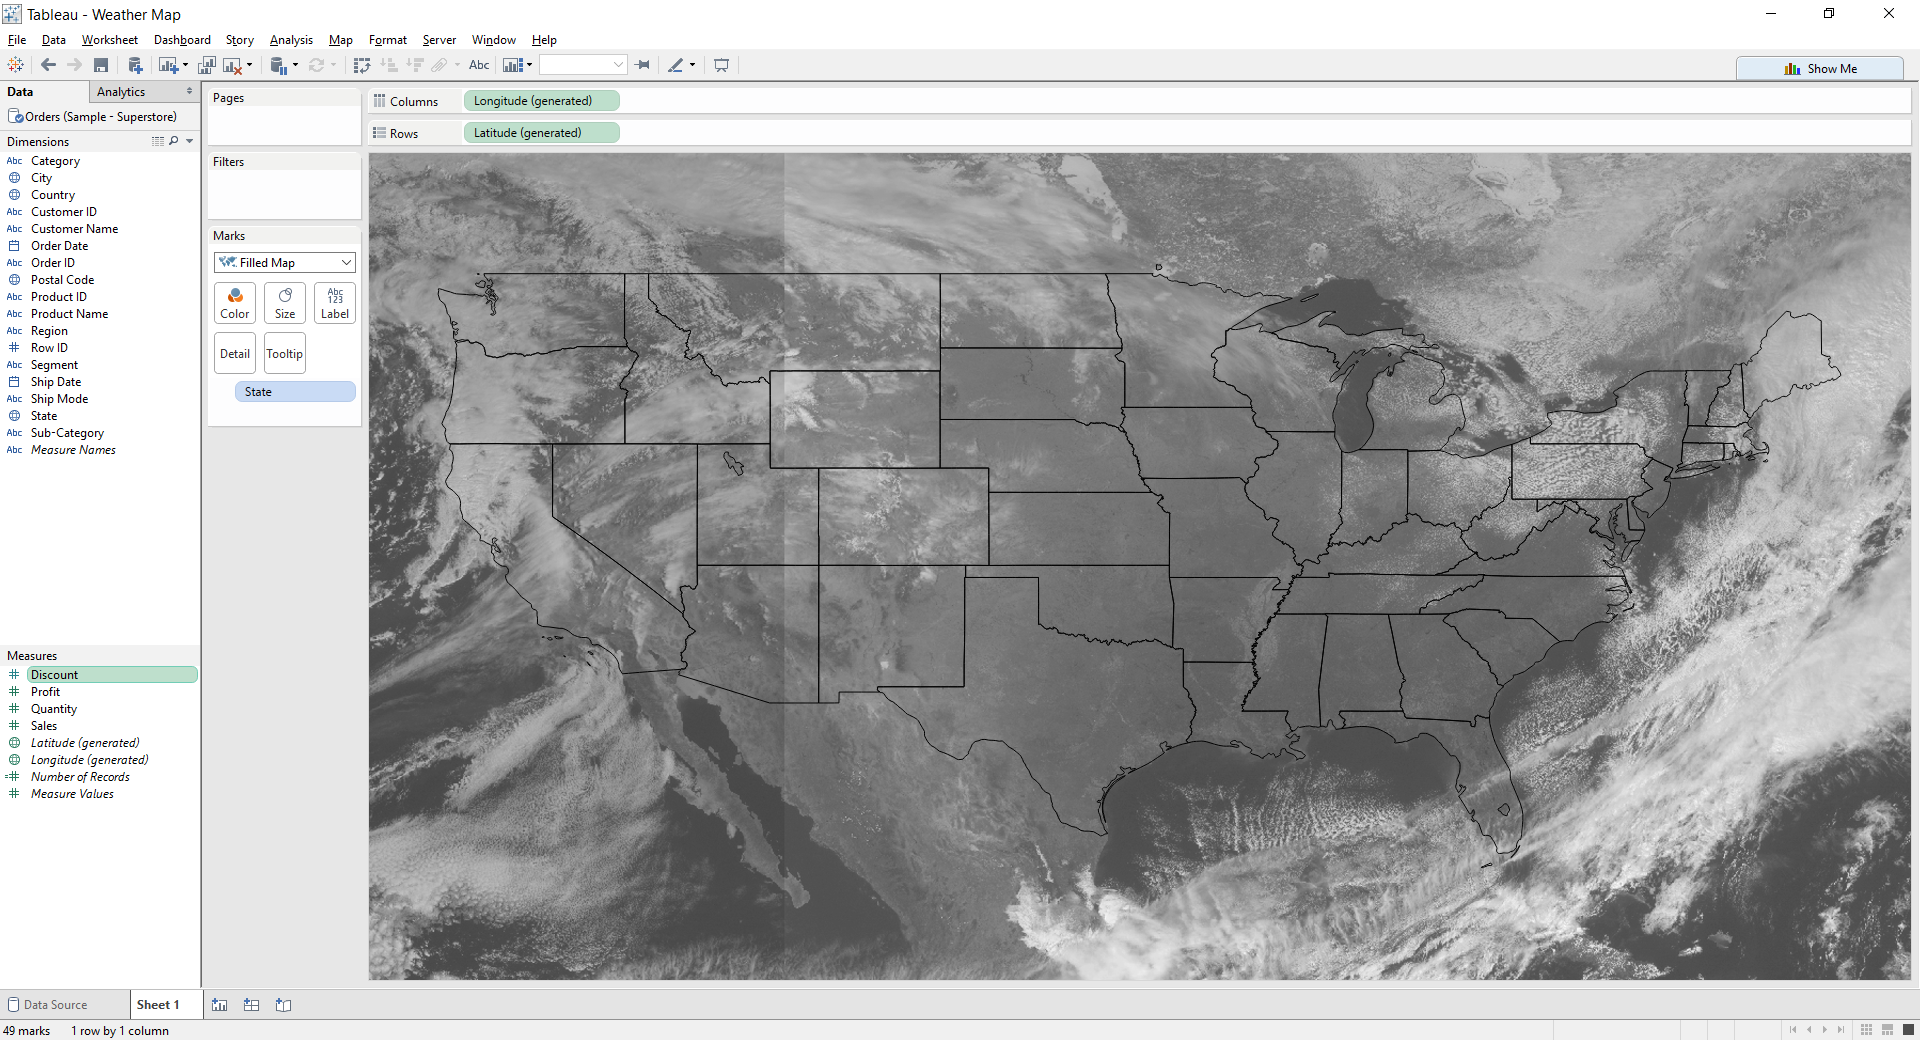
First we’re going to need to build a filled map of the United States. Using Sample Super Store, drag State to the Detail shelf. Now change the Mark Type to Filled Map:
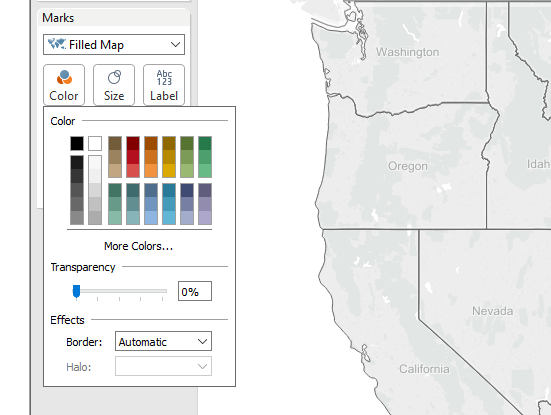
Now that we have our basic map, lets adjust the transparency of our marks. Click on Color in the Marks card and turn the Transparency to 0%.
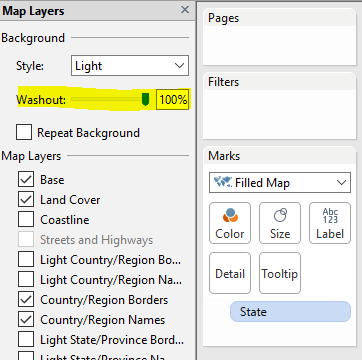
Let’s washout Mexico, Canada and Cuba by going to Map -> Map Layers -> Washout. Turn it all the way up to 100%:
Pulling the Weather Data
We now have our borders and states to help us make some sense of this new map we’re about to create. In order to pull in weather data, we need to have a WMS server. Thankfully, I have a list of currently online WMS servers run by Iowa State that we can plug into Tableau. All we need is the URL:
- CONUS GOES Visible Satellite
http://mesonet.agron.iastate.edu/cgi-bin/wms/goes/conus_vis.cgi - CONUS NEXRAD Base Reflectivity
http://mesonet.agron.iastate.edu/cgi-bin/wms/nexrad/n0q.cgi
The first URL is for Visible Satellite, and the second URL is for NEXRAD Doppler Radar. Highlight and copy the URL for GOES Visible Satellite: http://mesonet.agron.iastate.edu/cgi-bin/wms/goes/conus_vis.cgi?
Instead of using the three standard Tableau maps (Tableau, Offline, None), we’re going to use our own mapping server. Click on Map -> Background Maps -> Map Services…
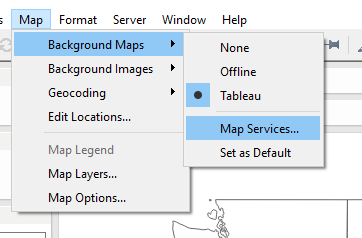
Once there, we need to add a new server by clicking Add -> WMS Servers…
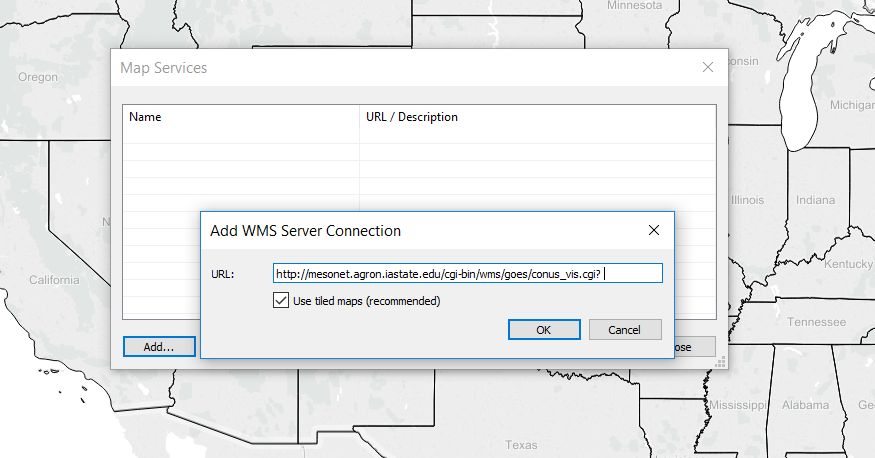
Once the URL is copied, click OK. If you have an internet connection and the server is online, our map should change right away:
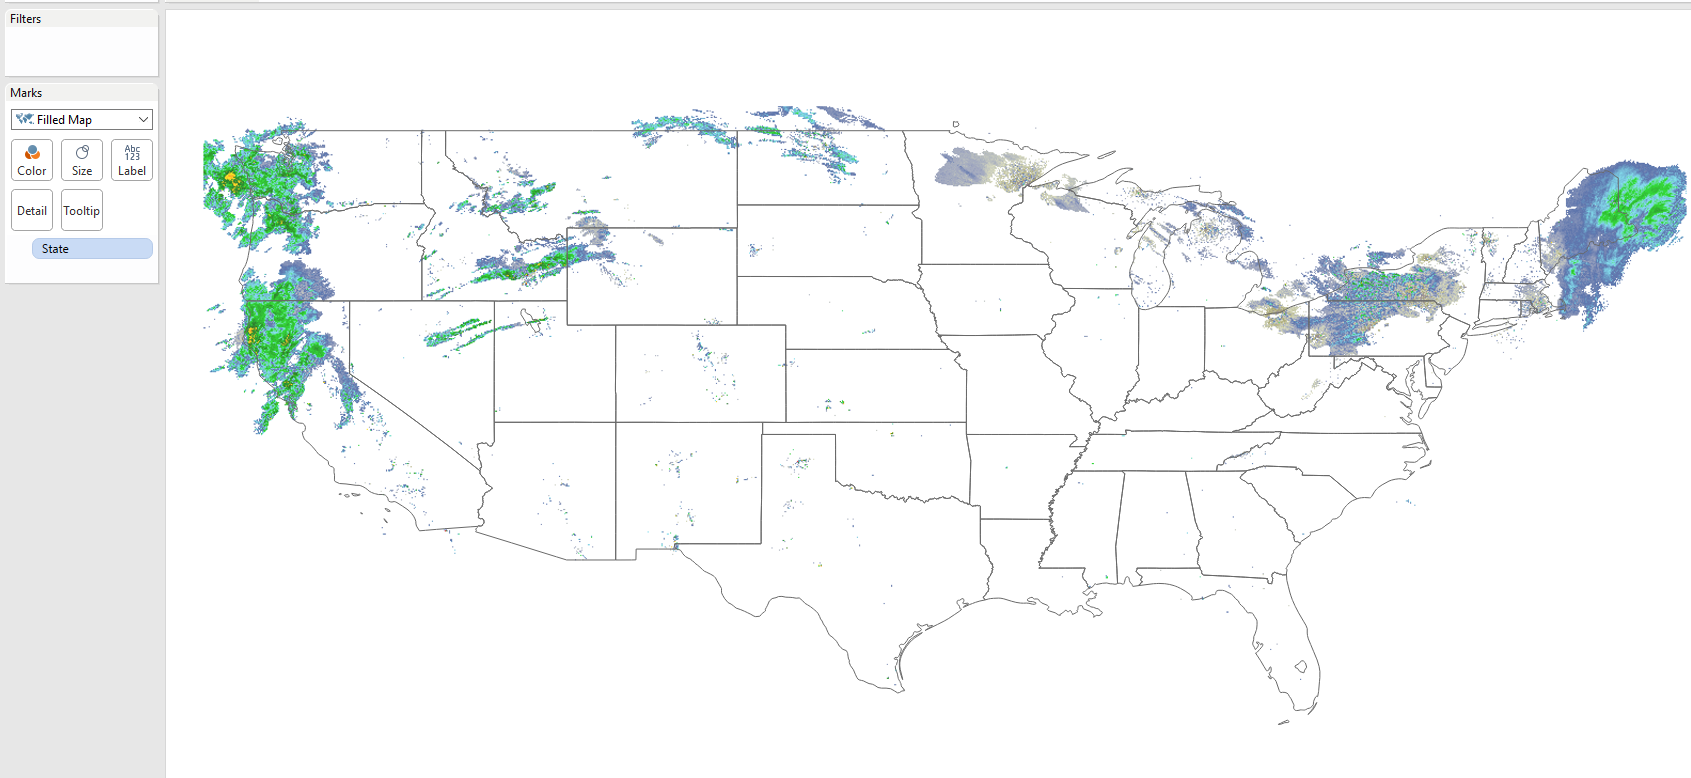
Now we have a satellite image of the clouds in the United States. Looks like fairly nice weather today in the Midwest. Some rain on the west coast and New England seems to be a bit cloudy, as well. This image can be refreshed for the newest satellite data by hitting the F5 key.
Maybe we’re wanting to get a little more information on the storm system on the West Coast. Instead of looking at visible imagery, let’s switch our WMS server over to Radar mode. Let’s add another WMS server the same way we did before, but let’s use the URL for reflectivity: http://mesonet.agron.iastate.edu/cgi-bin/wms/nexrad/n0q.cgi?
Our map should look something like this:
Not much going on in the middle part of the country, but it looks like Northern California is getting some rain. Let’s zoom in. Using a Dual Axis Map, I’ve added city names to the Detail shelf and changed the marks to circles:
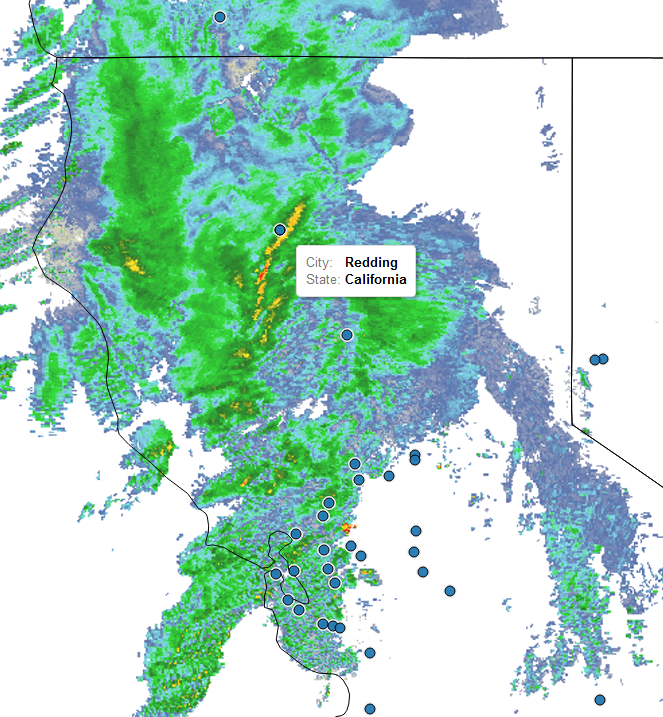
Zooming into Northern California, it looks like the town of Redding is about to get some moderate rain fall. To get the latest radar return, just hit the F5 key.
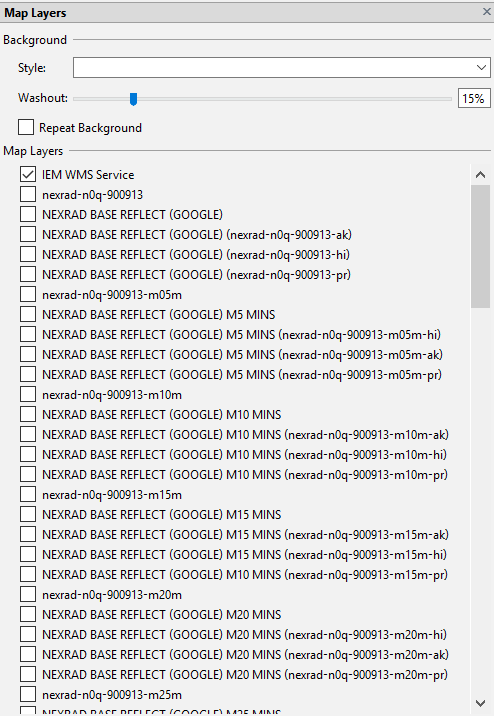
Adjusting Layers
Depending on how the WMS server is configured, we can adjust the layers we want to see just like if we turned on Streets and Highways in a normal Tableau map. Click Map -> Map Layers to bring up the layers:
This probably won’t replace a dedicated radar app like WSV3 or RadarScope for us hardcore chasers, but it can provide some insight into what the weather might be doing to our data. Here’s the final product of our efforts in viz form:
