Advance with Assist shares quick solutions to common challenges encountered by the InterWorks Assist on-demand team.
Question: I’ve been making updates to our Tableau visualizations, and I can’t seem to figure out how to create a mark on the latest date. I also would like to know whether that mark is more or less than the previous date. Is this possible? If so, can you explain how to do it?
This client reached out via our live chat feature in Assist, and we instantly started a screenshare working session to get them fixed up. This write-up shows how to add what they were after.
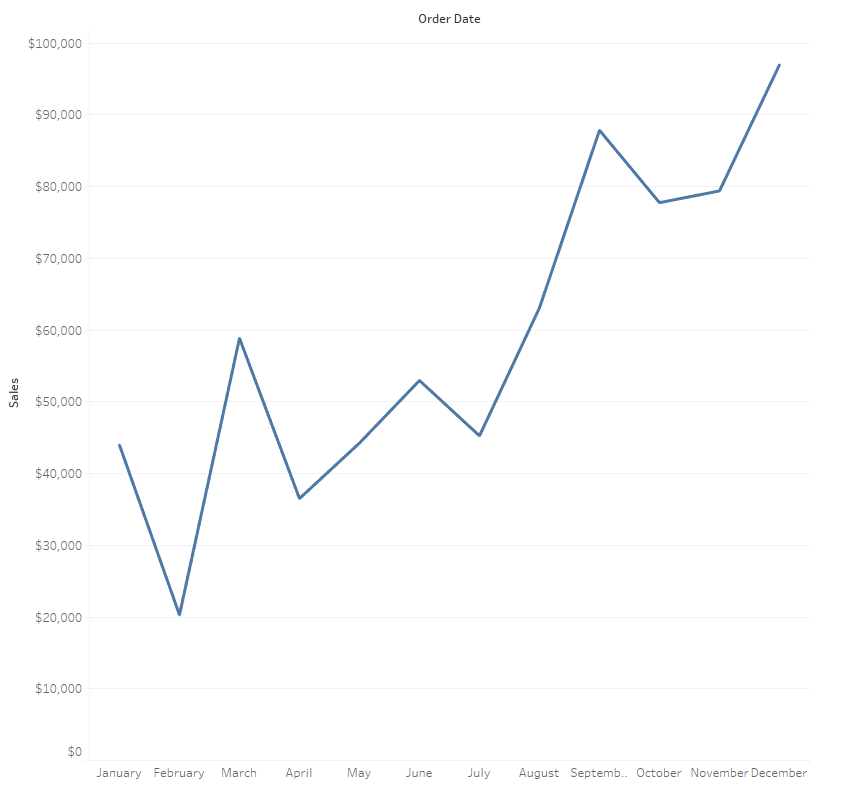
We’ll start with a simple trend line by Month:

Finding the most current date in a Tableau visualization has taken on many approaches over the years. Some use table calculations, others use LODs, etc. The method I seem to default to is LOD. The two most common functions I’ve seen are DATEPART and DATETRUNC within this logic to get the filtering right:

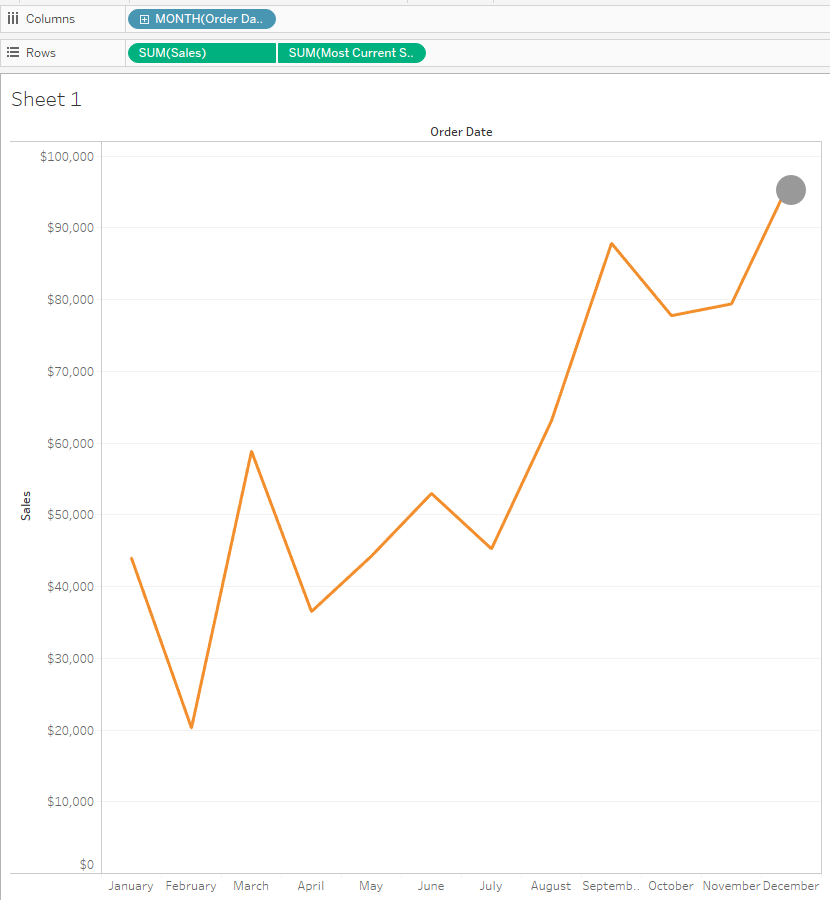
Adding this to a dual-axis synchronized chart, I now have the latest date marked with a circle:

The second part of this question is creating an arrow based on whether it is above or below the previous date.
This is where table calculations come into play. We could right-click the Most Current Sales pill here and add a table calculation, but it will cause multiple circles to appear as it goes across the table since previous pills date forward from left to right. Instead, we just need to write our own calculated field using a table calculation.
Here’s the standard Difference From table calculation formula. I’ve simply added a >0, making it a Boolean True/False:

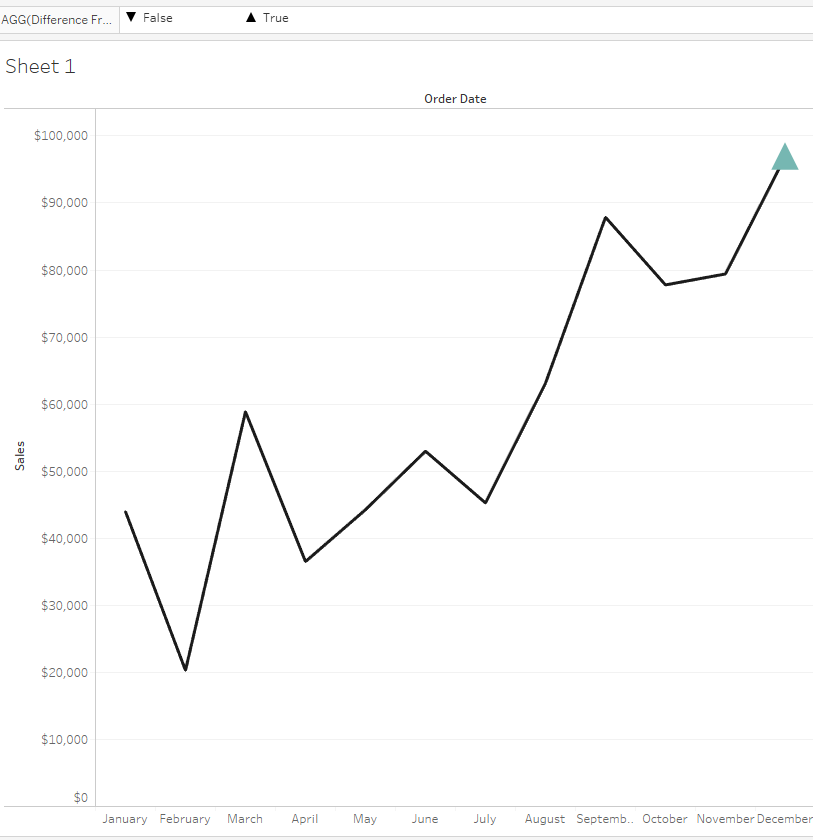
Adding this new field to the Shape and Color shelves, I can then create the arrow and color based on the requirements the client needed:


