Tableau Essentials: Formatting Tips – Introduction
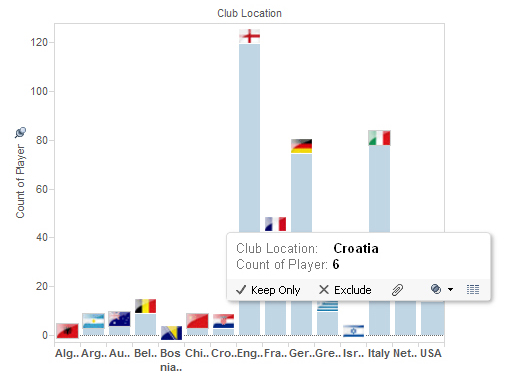
Now that we have some basics out of the way and a few chart types in our arsenal, it’s time to move onto some of the finer points of data visualization in Tableau. First, let’s talk about formatting. Most of us know the saying, “don’t judge a book by its cover,” but that couldn’t be […]
10 Questions for Tableau Zen Master Ramon Martinez

I met Ramon Martinez via Twitter before I met him in person. Ramon is a fellow Tableau Zen Master and works as a specialist in health metrics at the Pan American Health Organization (PAHO/WHO). The first dashboard of Ramon’s that I recall seeing was this one. What I saw in his dashboard was a careful […]
Every Day Is Leg Day: Visualizing Cycling Data in Tableau

Early last year, I got some bad news after a routine doctor visit. The specifics are unimportant, but the gist is that I needed to make some significant changes in my life while I was still young enough to do so. I’ve always been a big guy, and you might have known that if we’ve […]
10 Questions for DBA Superstar Josh Varner

A couple years ago, Josh Varner was a consultant working on our BI team at InterWorks. The last time I saw Josh (when he was still on our team) was at the Vertica Conference in Boston. I was leaving early for a gig in New Jersey. I stopped by to say goodbye to the team. […]
2015 CFP Championship: Calculating Recruiting Distances in Tableau
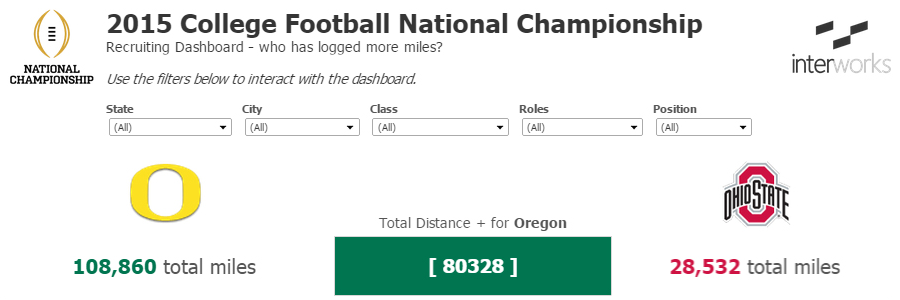
A couple weeks ago, I came across a College Football Playoff blog post that mapped the distance of each team’s campus to each player’s hometown. While detailed and visually appealing, you could not interact with the map – making it impossible to do more detailed analysis. This inspired me to create a Tableau dashboard that […]
Data Art: A Portrait of Wind in the US

Of the hundreds of data visualizations I’ve seen, only a few stand out as exceptionally striking. The design, subject and uniqueness all come together perfectly. One of them is the animated Wind Map at Hint.fm. I can practically feel the air moving along the smooth, sweeping lines. It inspired me to try mimicking it in […]
Frequently Asked Questions from Tableau Training: Vol. 1

Chances are, several people have the same questions about Tableau as you do. The Questions from Tableau Training series spotlights these questions and provides answers. Questions are pulled straight from InterWorks’ Tableau training classes. You can check out the full list of posts on the Questions from Tableau Training blog channel. As I travel the […]
DataGravity Discovery Series Solution Short: Virtualization
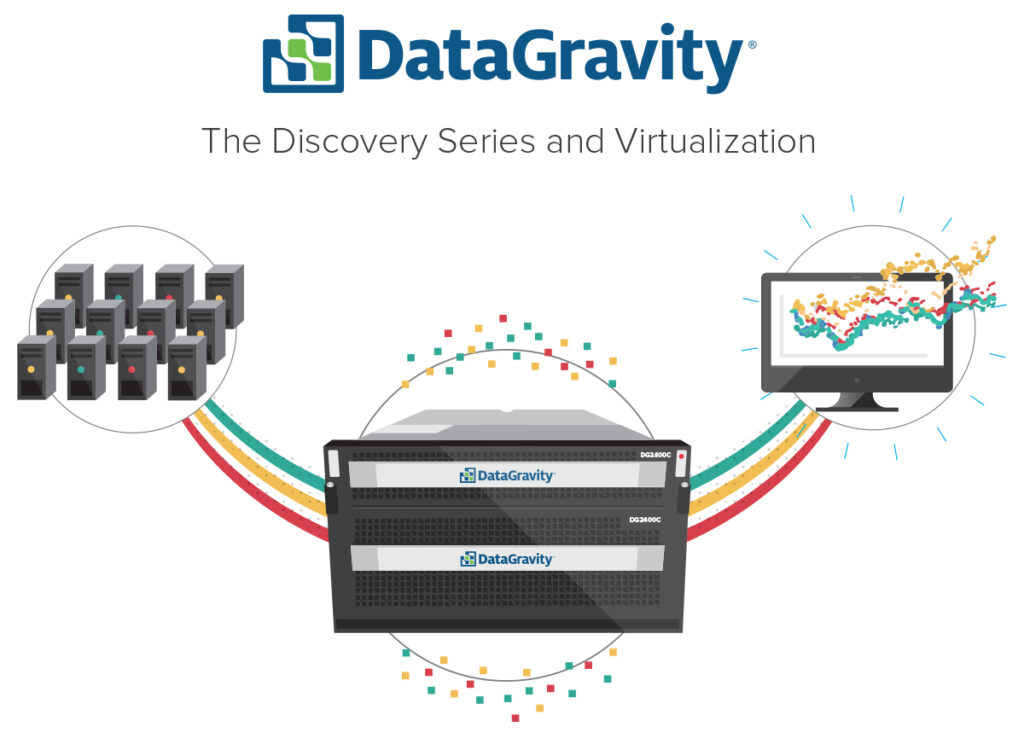
This is the second post in yet another blog series covering DataGravity’s Discovery Series. We’re calling this group our “Discovery Series Solution Shorts,” and these posts give you a broad overview of key features found in the Discovery Series. This post focuses on how DataGravity complements Virtualization. You can view all posts within this series on […]
10 Tableau Maxims

What is a maxim? According to Merriam-Webster: “A general truth, fundamental principle or rule of conduct.” Recently, I read a book called “Clear and Simple as the Truth” that got me thinking about maxims. The authors reference a French essayist named François de La Rochefoucauld, who wrote a book of maxims translated into English as “Reflections; or Sentences and […]
Row-Level Highlighting in Tableau
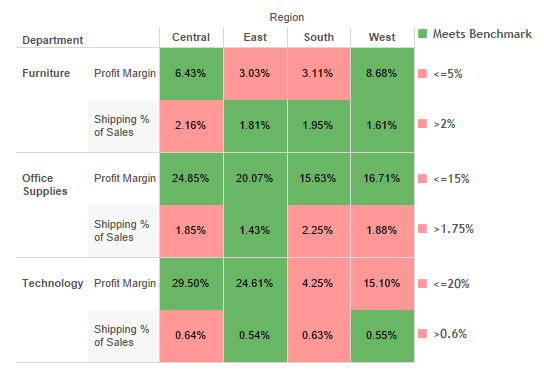
Highlight tables can be a great way to help users quickly spot the most interesting values in a table of numbers. In cases where multiple variables are displayed, Measure Values can be used to apply a single color scheme to all of the values in a table. Unless the variables are very similar, applying the […]
