Tableau Essentials: Calculated Fields – Number Functions
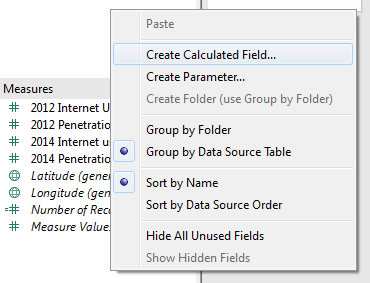
Not everyone is a Tableau guru, at least not yet. To help Tableau rookies, we’re starting from square one with the Tableau Essentials blog series. The series is intended to be an easy-to-read reference on the basics of using Tableau Software, particularly Tableau Desktop 8.1 and 8.2. Since there are so many cool features to […]
Interacting with your trend line in Tableau (Part 2)
PART 2 In part one we familiarised with Tableau’s automatic Trend Line, information provided and inferences possible. Now I want to focus on the fun part: how to calculate the trend line ourselves using Tableau-R integration as well as two applied examples “How much above/below ?” and “What if”. HOW TO CALCULATE A LINEAR TREND LINE USING TABLEAU & R […]
10 Questions for Tableau Biochemist Nicole Nichols, Ph.D.
Last summer, I was invited to speak for the Boston Tableau User Group at the Broad Institute. This was a different crowd, composed of mainly scientists. There were two Zen Masters in attendance: Chuck Hooper and Jonathan Drummey. Prior to my speech, I had the good fortune to see Nicole Nichols, Ph.D., present a talk on her use of Tableau to support DNA […]
The Tableau Performance Checklist: Data – Remove Unused Columns from Extracts
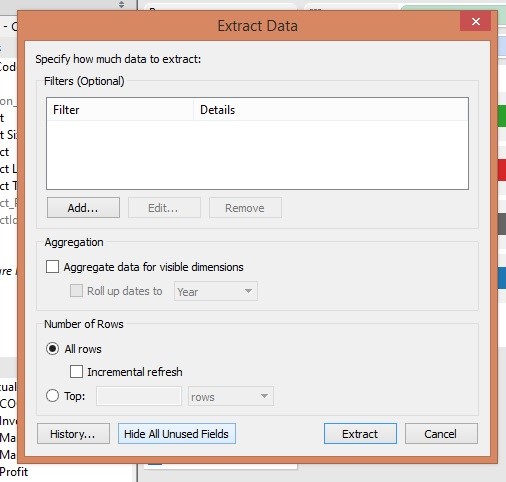
Rarely do you have a data connection that has only the data you need. Typically, we end up with data connections that include many columns that are unnecessary for our analysis. In the early phases of your analysis, it can be tough to judge what you do and do not need, but as a workbook […]
Three Keys to Enabling a Prudent Data Strategy

The volume, velocity and variety of data (Big Data) has been beaten to death over the last few years. I think it’s a silly metaphor. Why? How many of you have “run out” of storage recently? Has your company told you that you can’t have any more data because they don’t have space left to […]
Tableau Essentials: Calculated Fields – Logical Functions
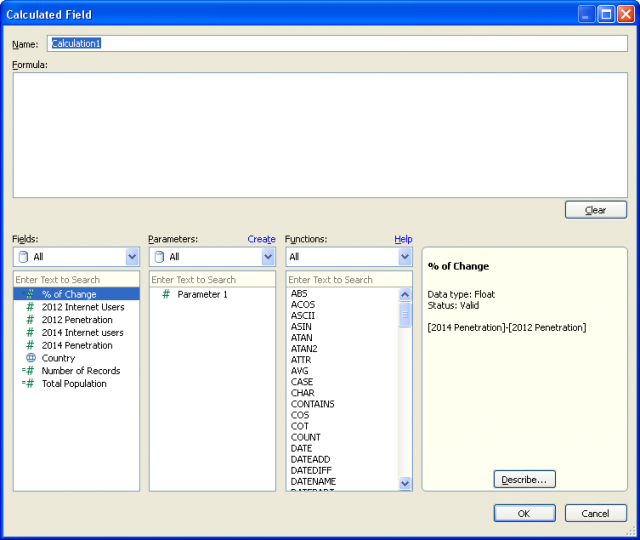
Not everyone is a Tableau guru, at least not yet. To help Tableau rookies, we’re starting from square one with the Tableau Essentials blog series. The series is intended to be an easy-to-read reference on the basics of using Tableau Software, particularly Tableau Desktop 8.1 and 8.2. Since there are so many cool features to […]
InterWorks Expert Hotline for Tableau…
Having difficulty unlocking the true potential of Tableau? Do you spend minutes/hours staring at the screen and thinking, “this should be easier than it is” or “how do I do this?!”, well you’re not alone. Tableau in its own right is an awesome piece of software, however, there can be moments when we all […]
InterWorks Presents Data Strategy Session at DRIVE/2015
A little over two weeks ago, several InterWorks BI leaders attended the Drive/2015 Conference. The mission of Drive/ is to bring together IT and data professionals from all industries to foster new ideas and relationships. Key areas of focus include data, reporting, information, visualization and exchange. Given our wealth of data experience, InterWorks was asked […]
RBS 6 Nations 2015 – Breakdown by Game
I think it’s safe to say that the dust has FINALLY settled on this year’s RBS 6 Nations Championship. What started with a whimper almost 7 weeks ago in Cardiff, ended in what can only be described as an earth shattering explosion of top class Rugby on probably,* the best Super Saturday we are ever likely […]
10 Questions for Tableau Visionnaire Gaëlle Periat
After completing my first book, I enjoyed traveling all over North America and Europe speaking at companies and Tableau User Groups. A big part of the fun was meeting hundreds of Tableau users. One of the first user groups to contact me to ask if I would be willing to speak was in Paris. The […]
